Quote
Hi @all, what sup, how are you going dawg ? Legit insane last two weeks with new decision and more stuff around choosing next path for my career. Honestly, I can comeback a last week but not have much thing to write and kinda lazy as well, so I just finalize little things and turn back, maybe with the last AWS Resources before you have multiple new contents from my blog, let’s see. BTW, Today we will learn and research about AWS Monitoring Stack, and how you can get once it for yourself or your product. Let’s digest !
Cloud Monitoring Stack

Source: Internet
The truth, among Cloud Services nowadays is ensure to have at least once of monitoring system, kinda internal with leveraging on technologies and services of this platform, no cap. You can google anything about that and you can see many information relating into this implementation, such as
- AWS: CloudWatch, X-Ray, CloudTrail,… Explore more about AWS Monitoring at AWS - Monitoring and observability
- Azure: Monitor, Log Analytics, Metric Explorer, … Explore more about Azure Monitor at Azure Monitor
Note
Especially, Both of these clouds, they turn Grafana and Prometheus into one of monitoring and observability stack for integrating and developing to help them create managed services from their own Cloud.
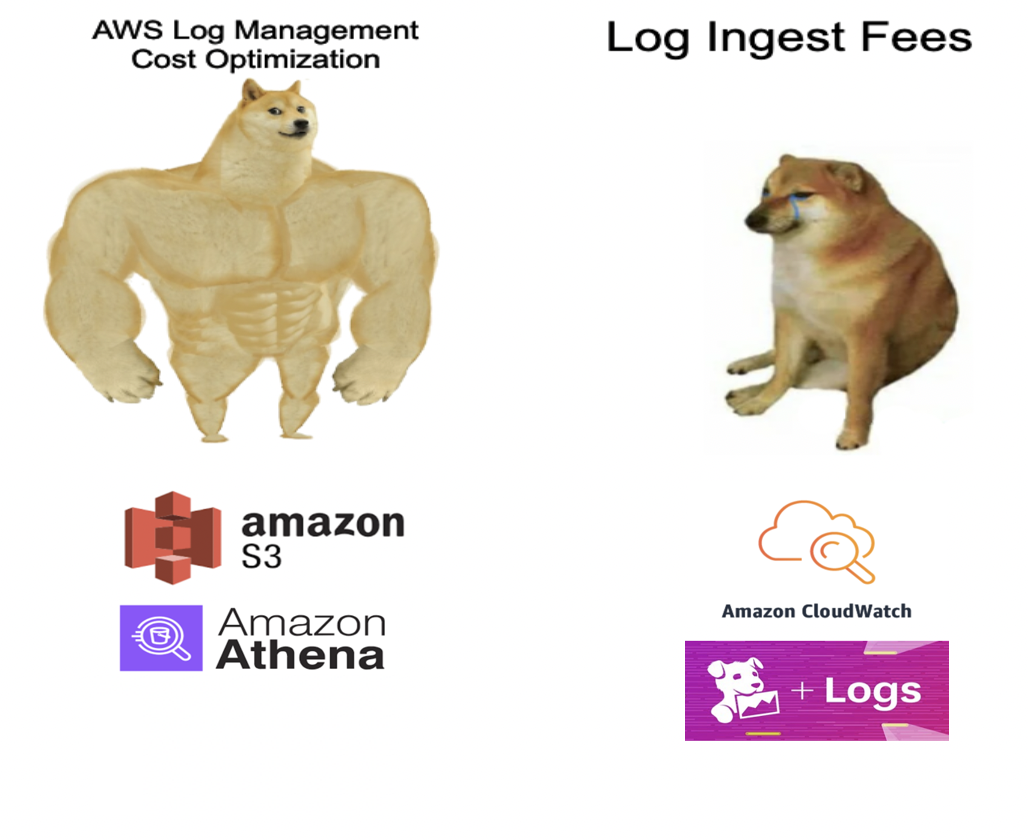
When you try to operate with those internal stacks, It really be able to give you a good quality and condition to easily catch up any event in your whole cloud services but you need pay lots of for these implementation. Cuz, most of them is really expensive, so you need to consider before deciding to spend money for these ones
If you are not well-off, let’s say thinking more about opensource that bring of same quality but more difficult to involve into your whole cloud services.
Source: Internet
Abstract
But you want to find the enhancement tools, easily manage and kinda friendly with Cloud Service developers, then you can operate that stack with no much effort and with Terraform made your work becoming easier as well.
More, and More about AWS Monitoring
Turning back into topics, I will focus on AWS Monitoring and we can leverage into these technologies which implemented by AWS and give us bunch of things to use, practice and play. Honestly, They is super fun but need a time to actually catch up this. Now, we will try figure out among of us.
Source: AWS
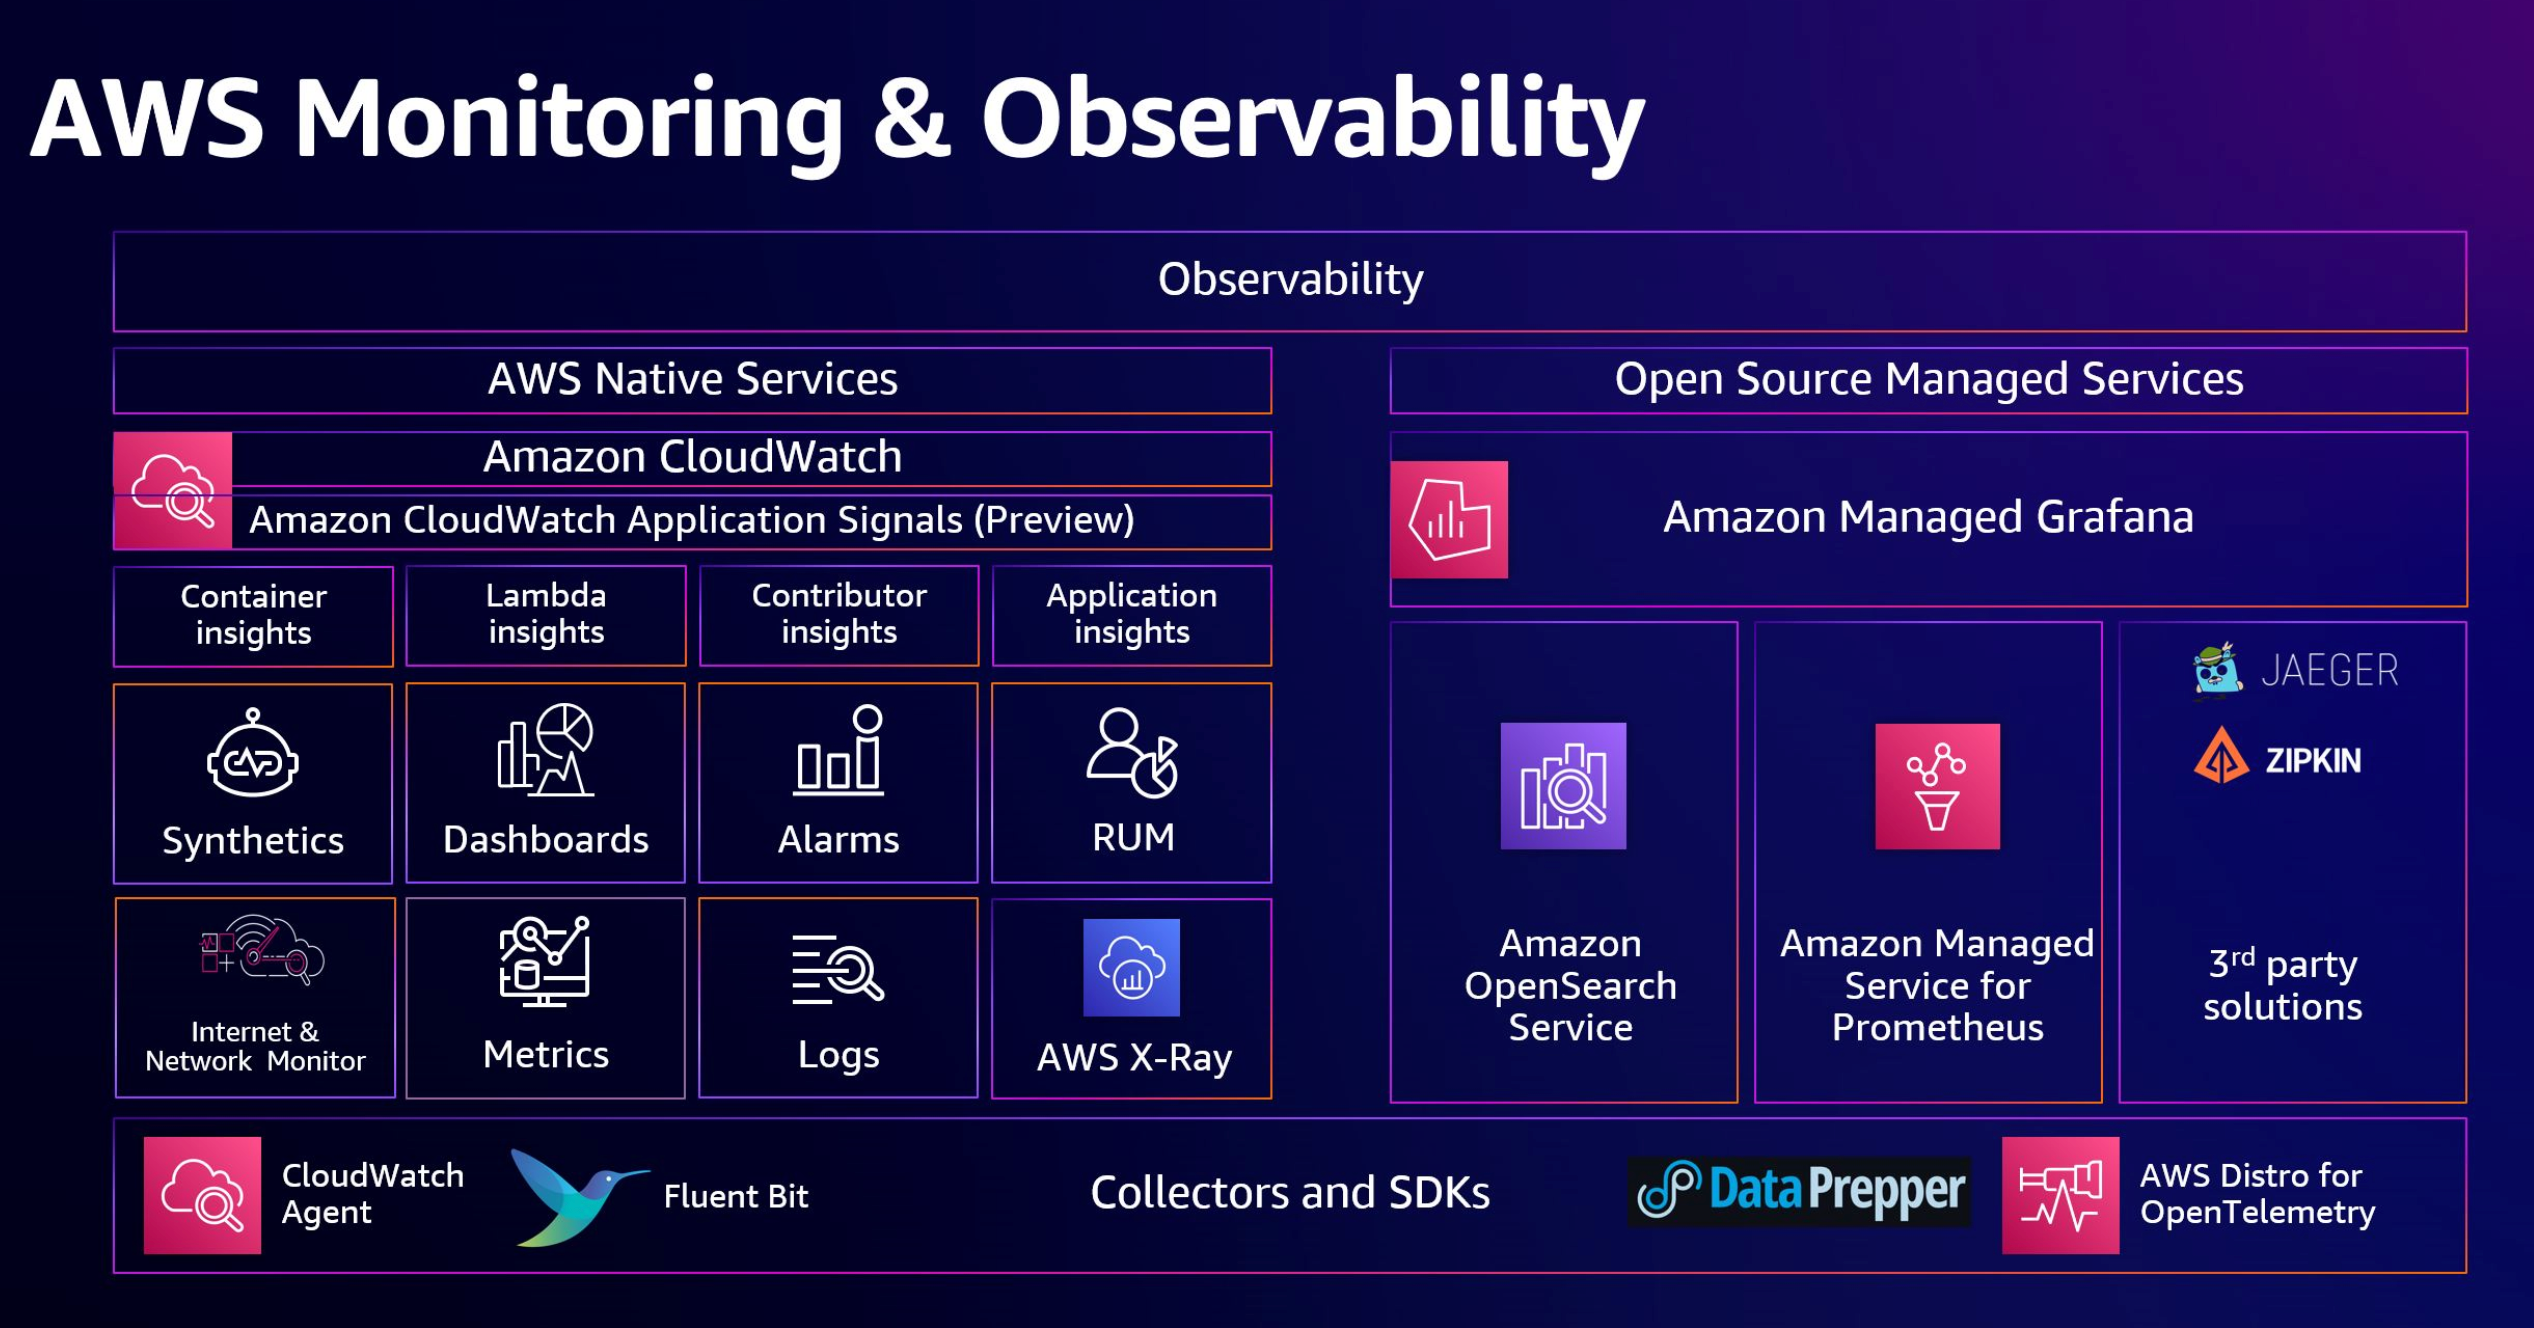
First of all, you need to check it out at AWS Documentation - Choosing an AWS monitoring and observability service to figure out your decision to choose what AWS Monitoring Stack. As you can see, AWS have two categories when you want to operate fullstack monitoring and observability for their cloud
- AWS Native Services: Using CloudWatch, XRay, …
- AWS Open Source Managed Services: Using Grafana, Prometheus, …
I don’t have much experience to give you advise with right expectation, but you can imagine if you want to find one stack with integrating and easily approach with AWS Services, you can choose Native Style but you want to make more configuration, detail as your expectation, so you can go with Open Source. In conclusion, both of them give us the ability to monitor through three key data sources
- Metrics
- Logs
- Traces
More and more to try, also you can set up alert depended on what anomaly events was detected and your monitoring can send to your email, slack or whatever to aware about that events. We will try to build full of this one in practice session.
In this session, I will focus on Native module because I actual work on it and really useful to see what you can do inside your AWS Cloud. Let’s figure out cloudwatch, a powerful thing that we are working with.
AWS CloudWatch
Source: AWS
For me, CloudWatch is legit insane with powerful integrating, anything event relate your service, It’s all stored inside CloudWatch, how the magical. CloudWatch give us the UI/UX kinda not friendly, but I’am wrong, cuz when you try setup full dashboard, or alert, you can see anything events and actions inside only CloudWatch Portal
Info
Amazon CloudWatch monitors your Amazon Web Services (AWS) resources and the applications you run on AWS in real time. You can use CloudWatch to collect and track metrics, which are variables you can measure for your resources and applications.
With any services inside AWS, If you click enable Metrics or Logs, your service will send these data sources direct into CloudWatch with no more care about enough resource to receive that log, that one thing I really surprise.
Nowadays, Scalability is becoming trend of technological things and when you use services with H/A to compatible with scale monitoring system. But you need see with two faces, like I said above, you need pay a lot for this one because the actual concept behind CloudWatch, It’s really huge and you need to consider good enough to not cause over your budget 😃.
You can try explore more about CloudWatch inside couple topics, such as
With CloudWatch, you gain system-wide visibility into resource utilization, application performance, and operational health.
Ability of CloudWatch
Source: Internet
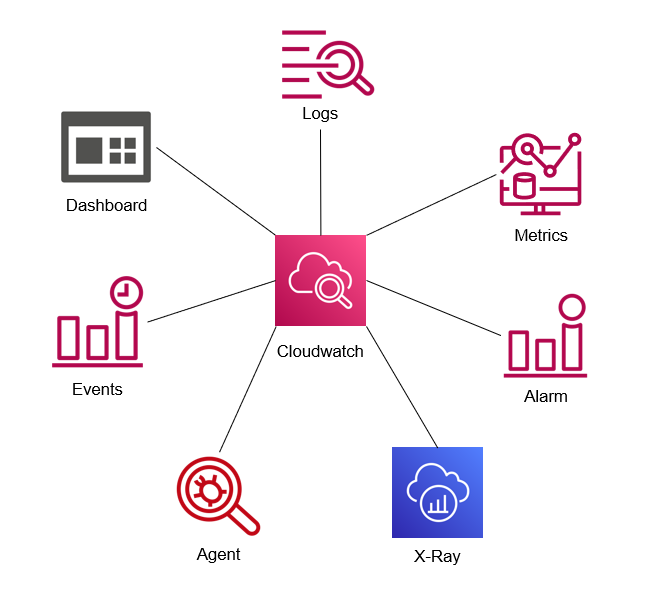
Being excited when I work CloudWatch, It has enough ability to become fullstack monitoring system for sure. Because, I don’t try much with trace so not relate that here, but with other options, CloudWatch actually massive as a Beast. You can do a lot of stuff with CloudWatch, and the creative thinking maybe unlimited 😄. I hope everyone can have one after this article.
As you can see, CloudWatch provide the place to create your monitoring system as ecosystem, such as
With CloudWatch, It isolates with awesome ability, including
- Highly resilient
- Fault tolerant
- Built for scale
All of these things, It is legit convince AWS CloudWatch is good condition to handy and adapt for your monitoring and observability stack from scratch. Next, We will try to figure out create fullstack monitoring with AWS CloudWatch and AWS Integrate Services
Practical Session
Question
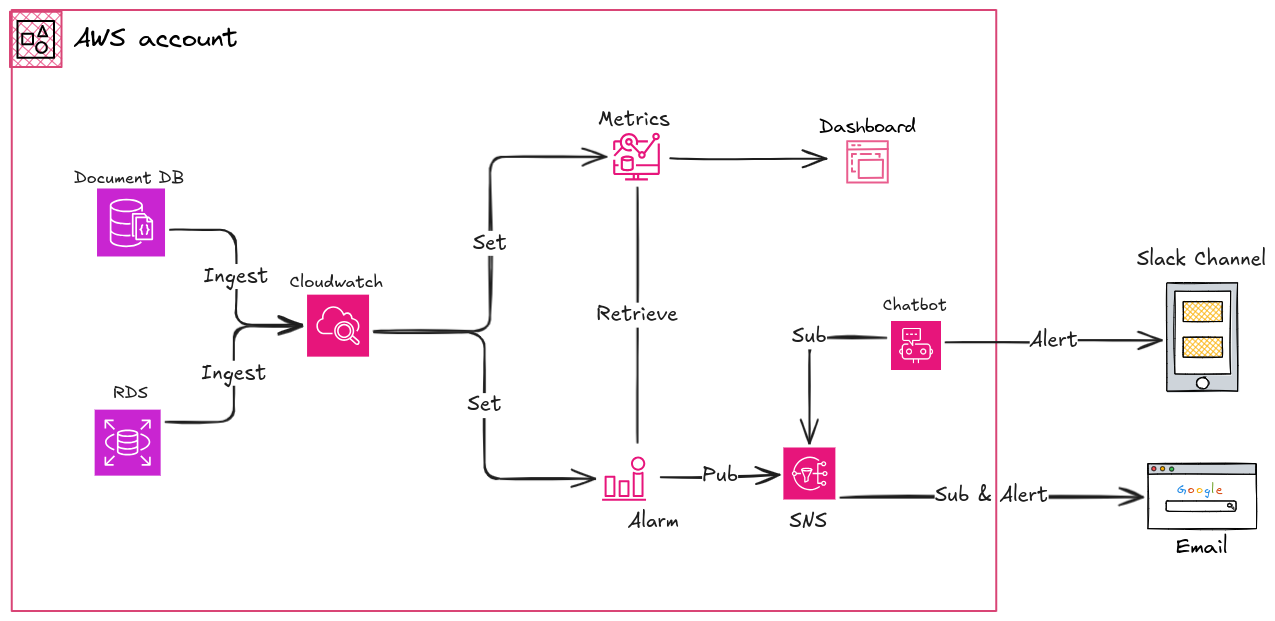
In this practical session, we will try to monitoring DocumentDB and RDS through metrics of these platform, send it into dashboard and create the alarm for both email and chatbot used Slack. Now we will gone through each part
In this session, We will try provision whole of process with Terraform to easily catch and maintain
Visualization Metrics in Dashboard
Depend on the dashboard of CloudWatch, you have multiple type to visualizer your metrics inside this one. Explore this one through article AWS Documentation - Using Amazon CloudWatch dashboards
To Ensure your Terraform Provisioner be able work with CloudWatch, It means your shell or agent like Atlantis have permission to create and access CloudWatch Dashboard. In the good situation, you can set CloudWatchFullAccess to doing stuff around CloudWatch but wanna relate with other services, You may set with AdministratorAccess
First of all, double check in your configuration, your documendb and rds is sent metrics and logs into CloudWatch. If you validate it with your metrics and logs that able in your CloudWatch, you can create dashboard immediately.
Back to monitoring, you can create the structure of project for monitoring stuff like this
terraform-module-aws-monitoring-stack
├── backend.tf
├── cloudwatch_chatbot.tf
├── cloudwatch_dashboard.tf
├── cloudwatch_documentdb_alarm.tf
├── cloudwatch_rds_alarm.tf
├── cloudwatch_sns.tf
├── .gitignore
├── local.tf
├── main.tf
├── outputs.tf
├── .pre-commit-config.yaml
├── providers.tf
├── README.md
├── .terraform
│   ├── providers
│   │   └── registry.terraform.io
│   └── terraform.tfstate
├── .terraform-docs.yml
└── .terraform.lock.hcl
With still have same configuration as well with Terraform module in couple prev session, so I just focus on what new in this practical.
My advise when you work with Dashboard and Terraform, you should create dashboard in CloudWatch portal first, and try to retrieve the source to synchronize your Terraform with your CloudWatch. Explore configuration Terraform at Resource: aws_cloudwatch_dashboard
I can show you right configuration because this really dangerous, but you can imagine with attaching link to figure out the configuration. For example
resource "aws_cloudwatch_dashboard" "main" {
  dashboard_name = "my-dashboard"
  dashboard_body = jsonencode({
    widgets = [
      {
        "height": 1,
        "width": 24,
        "y": 56,
        "x": 0,
        "type": "text",
        "properties": {
          "background": "transparent",
          "markdown": "RDS\n--- \n"
        }
      },
      {
        "height": 12,
        "width": 24,
        "y": 57,
        "x": 0,
        "type": "explorer",
        "properties": {
          "aggregateBy": {
            "func": "",
            "key": ""
          },
          "labels": [
            {
              "key": "Name",
              "value": "xxxxxxxxxxxxxxxxxxxxxxxx"
            },
            {
              "key": "Name",
              "value": "xxxxxxxxxxxxxxxxxxxxxxxx"
            }
          ],
          "metrics": [
            {
              "metricName": "CPUUtilization",
              "resourceType": "AWS::RDS::DBInstance",
              "stat": "Average"
            },
            {
              "metricName": "DatabaseConnections",
              "resourceType": "AWS::RDS::DBInstance",
              "stat": "Maximum"
            },
            {
              "metricName": "FreeStorageSpace",
              "resourceType": "AWS::RDS::DBInstance",
              "stat": "Average"
            },
            {
              "metricName": "FreeableMemory",
              "resourceType": "AWS::RDS::DBInstance",
              "stat": "Average"
            },
            {
              "metricName": "ReadLatency",
              "resourceType": "AWS::RDS::DBInstance",
              "stat": "Average"
            },
            {
              "metricName": "ReadThroughput",
              "resourceType": "AWS::RDS::DBInstance",
              "stat": "Average"
            },
            {
              "metricName": "ReadIOPS",
              "resourceType": "AWS::RDS::DBInstance",
              "stat": "Average"
            },
            {
              "metricName": "WriteLatency",
              "resourceType": "AWS::RDS::DBInstance",
              "stat": "Average"
            },
            {
              "metricName": "WriteThroughput",
              "resourceType": "AWS::RDS::DBInstance",
              "stat": "Average"
            },
            {
              "metricName": "WriteIOPS",
              "resourceType": "AWS::RDS::DBInstance",
              "stat": "Average"
            }
          ],
          "period": 60,
          "region": "ap-southeast-1",
          "splitBy": "",
          "widgetOptions": {
            "legend": {
              "position": "bottom"
            },
            "rowsPerPage": 2,
            "stacked": false,
            "view": "timeSeries",
            "widgetsPerRow": 4
          }
        }
      },
      {
        "height": 1,
        "width": 24,
        "y": 69,
        "x": 0,
        "type": "text",
        "properties": {
          "background": "transparent",
          "markdown": "DocumentDB\n--- \n"
        }
      },
      {
        "height": 6,
        "width": 6,
        "y": 82,
        "x": 15,
        "type": "metric",
        "properties": {
          "metrics": [
            [
              "AWS/DocDB",
              "WriteThroughput",
              "DBClusterIdentifier",
              "xxxxxxxxxxxxxxxxxxxxxxxx",
              {
                "region": "ap-southeast-1"
              }
            ],
            [
              "...",
              "xxxxxxxxxxxxxxxxxxxxxxxx",
              {
                "region": "ap-southeast-1"
              }
            ]
          ],
          "period": 60,
          "region": "ap-southeast-1",
          "stacked": false,
          "stat": "Average",
          "view": "timeSeries"
        }
      },
      {
        "height": 6,
        "width": 6,
        "y": 70,
        "x": 0,
        "type": "metric",
        "properties": {
          "metrics": [
            [
              "AWS/DocDB",
              "CPUUtilization",
              "DBClusterIdentifier",
              "xxxxxxxxxxxxxxxxxxxxxxxx"
            ],
            [
              "...",
              "xxxxxxxxxxxxxxxxxxxxxxxx"
            ]
          ],
          "period": 300,
          "region": "ap-southeast-1",
          "stacked": false,
          "view": "timeSeries"
        }
      },
      {
        "height": 6,
        "width": 6,
        "y": 70,
        "x": 6,
        "type": "metric",
        "properties": {
          "metrics": [
            [
              "AWS/DocDB",
              "DatabaseConnections",
              "DBClusterIdentifier",
              "xxxxxxxxxxxxxxxxxxxxxxxx",
              {
                "region": "ap-southeast-1"
              }
            ],
            [
              "...",
              "xxxxxxxxxxxxxxxxxxxxxxxx",
              {
                "region": "ap-southeast-1"
              }
            ]
          ],
          "period": 60,
          "region": "ap-southeast-1",
          "singleValueFullPrecision": false,
          "stacked": false,
          "stat": "Maximum",
          "table": {
            "showTimeSeriesData": false,
            "stickySummary": true
          },
          "view": "timeSeries"
        }
      },
      {
        "height": 6,
        "width": 6,
        "y": 70,
        "x": 12,
        "type": "metric",
        "properties": {
          "metrics": [
            [
              "AWS/DocDB",
              "FreeLocalStorage",
              "DBClusterIdentifier",
              "xxxxxxxxxxxxxxxxxxxxxxxx"
            ],
            [
              "...",
              "xxxxxxxxxxxxxxxxxxxxxxxx"
            ]
          ],
          "period": 300,
          "region": "ap-southeast-1",
          "stacked": false,
          "stat": "Average",
          "view": "timeSeries"
        }
      },
      {
        "height": 6,
        "width": 6,
        "y": 70,
        "x": 18,
        "type": "metric",
        "properties": {
          "metrics": [
            [
              "AWS/DocDB",
              "FreeableMemory",
              "DBClusterIdentifier",
              "xxxxxxxxxxxxxxxxxxxxxxxx"
            ],
            [
              "...",
              "xxxxxxxxxxxxxxxxxxxxxxxx"
            ]
          ],
          "period": 300,
          "region": "ap-southeast-1",
          "stacked": false,
          "stat": "Average",
          "view": "timeSeries"
        }
      },
      {
        "height": 6,
        "width": 6,
        "y": 76,
        "x": 18,
        "type": "metric",
        "properties": {
          "metrics": [
            [
              "AWS/DocDB",
              "WriteIOPS",
              "DBClusterIdentifier",
              "xxxxxxxxxxxxxxxxxxxxxxxx"
            ],
            [
              "...",
              "xxxxxxxxxxxxxxxxxxxxxxxx"
            ]
          ],
          "period": 60,
          "region": "ap-southeast-1",
          "stacked": false,
          "stat": "Average",
          "view": "timeSeries"
        }
      },
      {
        "height": 6,
        "width": 6,
        "y": 76,
        "x": 12,
        "type": "metric",
        "properties": {
          "metrics": [
            [
              "AWS/DocDB",
              "WriteLatency",
              "DBClusterIdentifier",
              "xxxxxxxxxxxxxxxxxxxxxxxx",
              {
                "region": "ap-southeast-1"
              }
            ],
            [
              "...",
              "xxxxxxxxxxxxxxxxxxxxxxxx",
              {
                "region": "ap-southeast-1"
              }
            ]
          ],
          "period": 60,
          "region": "ap-southeast-1",
          "stacked": false,
          "stat": "Average",
          "view": "timeSeries"
        }
      },
      {
        "height": 6,
        "width": 6,
        "y": 76,
        "x": 6,
        "type": "metric",
        "properties": {
          "metrics": [
            [
              "AWS/DocDB",
              "ReadIOPS",
              "DBClusterIdentifier",
              "xxxxxxxxxxxxxxxxxxxxxxxx"
            ],
            [
              "...",
              "xxxxxxxxxxxxxxxxxxxxxxxx"
            ]
          ],
          "period": 60,
          "region": "ap-southeast-1",
          "stacked": false,
          "stat": "Average",
          "view": "timeSeries"
        }
      },
      {
        "height": 6,
        "width": 6,
        "y": 76,
        "x": 0,
        "type": "metric",
        "properties": {
          "metrics": [
            [
              "AWS/DocDB",
              "ReadLatency",
              "DBClusterIdentifier",
              "xxxxxxxxxxxxxxxxxxxxxxxx"
            ],
            [
              "...",
              "xxxxxxxxxxxxxxxxxxxxxxxx"
            ]
          ],
          "period": 60,
          "region": "ap-southeast-1",
          "stacked": false,
          "stat": "Average",
          "view": "timeSeries"
        }
      },
      {
        "height": 6,
        "width": 6,
        "y": 82,
        "x": 3,
        "type": "metric",
        "properties": {
          "metrics": [
            [
              "AWS/DocDB",
              "ReadThroughput",
              "DBClusterIdentifier",
              "xxxxxxxxxxxxxxxxxxxxxxxx"
            ],
            [
              "...",
              "xxxxxxxxxxxxxxxxxxxxxxxx"
            ]
          ],
          "period": 60,
          "region": "ap-southeast-1",
          "stacked": false,
          "stat": "Average",
          "view": "timeSeries"
        }
    ]
  })
}
Awesome, You may need change xxxxxxxxxxxxxxxxxxxxxxxx into your cluster documentdb and rds name to get validate dashboard for your provisioning. Now, You can apply it with running Terraform Workflow
terraform init
terraform plan
terraform apply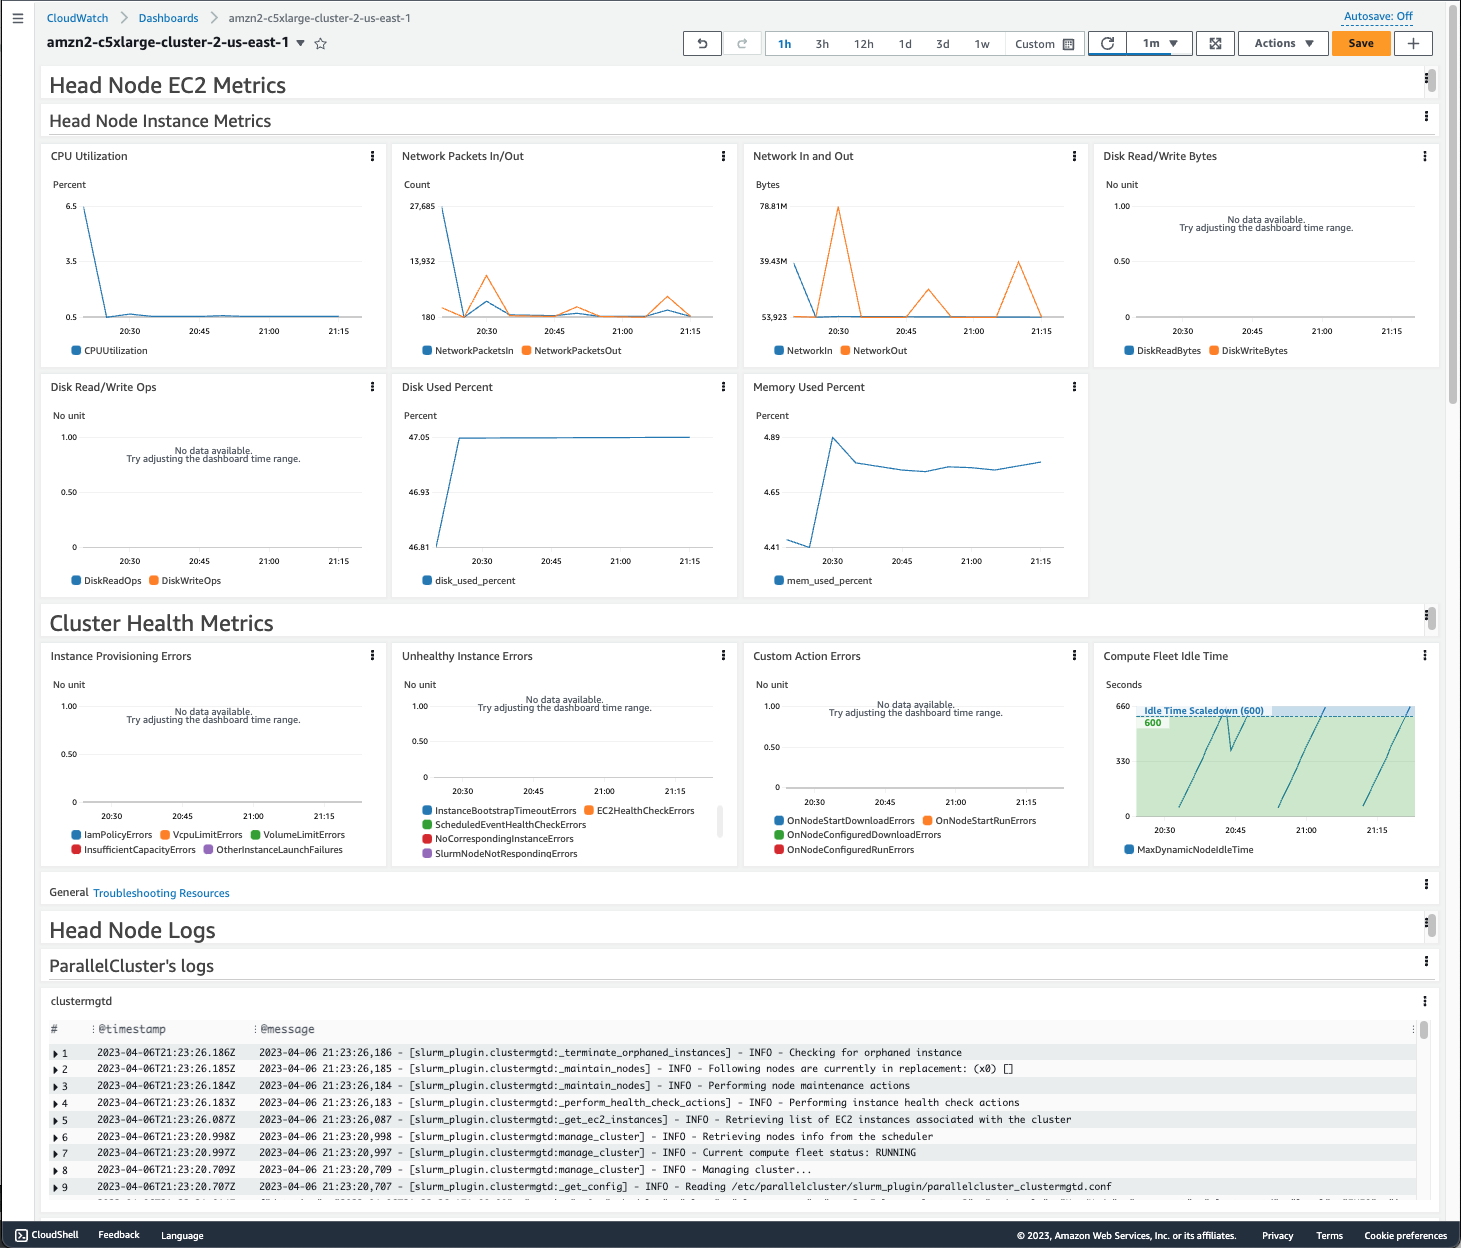
Dashboard example (Source: Internet)
Success
The result about you will have a complete dashboard for your monitoring of AWS Services
Create Alarm for AWS services
When you complete provision dashboard, you may think about how to react with traffic or anomaly event with DocumentDB and RDS. Let’s say CloudWatch offer Alarm for this stuff, come and check it out at AWS Documentation - Using Amazon CloudWatch alarms
In this part, we will separate that into Alarm Rule and How to send alarm as alert into another platform
First of all, We will try to focus on alarm rules, CloudWatch is full complete monitoring stack, and we can leverage all of metrics of these services to create a range or limit resources of services to let developer or cloud engineer know about this events. Rule will use CPU, Memory as two basic metrics to give rule to create alarm. BTW, There is many scenarios, not only CPU and Memory, so to have better behavior you need to figure out your services warning something, for example in my situation, It relates with number of connection into DocumentDB
Before starting, you can read couple articles to figure out what metrics you can for doing monitor and alert with DocumentDB and RDS
- AWS Blogs - Monitoring metrics and setting up alarms on your Amazon DocumentDB (with MongoDB compatibility) clusters
- Linkedin - How to monitor AWS RDS and how to set alarm???
Now let implementation that with Terraform, explore how to implement at Resource: aws_cloudwatch_metric_alarm
# Usage: Detect the lower memory event of RDS
# Theory: RDS with type t3.medium will have 4GB Memory = 4*1024 = 4096 (Byte)
# Expected not lower than 90% Memory = 90% * 4096 ~ 3700 (Byte)
# Threshold ~ 4096 - 3700 ~ 400 (Byte)
resource "aws_cloudwatch_metric_alarm" "rds_memory" {
  alarm_name          = "xxxxxxxxxxxxxxxxxxxxxxxx-lowMemory"
  comparison_operator = "LessThanOrEqualToThreshold"
  evaluation_periods  = 3
  metric_name         = "FreeableMemory"
  namespace           = "AWS/RDS"
  period              = 600
  statistic           = "Maximum"
  threshold           = 400
  alarm_description   = "Database instance memory above threshold"
  actions_enabled     = true
  alarm_actions       = []

  dimensions = {
    DBInstanceIdentifier = "xxxxxxxxxxxxxxxxxxxxxxxx"
  }
}

resource "aws_cloudwatch_metric_alarm" "rds_cpu" {
  alarm_name          = "xxxxxxxxxxxxxxxxxxxxxxxx-highCPU"
  comparison_operator = "GreaterThanOrEqualToThreshold"
  evaluation_periods  = 3
  metric_name         = "CPUUtilization"
  namespace           = "AWS/RDS"
  period              = 600
  statistic           = "Maximum"
  threshold           = 80
  alarm_description   = "Database instance CPU above threshold"
  actions_enabled     = true
  alarm_actions       = []

  dimensions = {
    DBInstanceIdentifier = "xxxxxxxxxxxxxxxxxxxxxxxx"
  }
}# Usage: Detect the high increasing of DocumentDB Connection
# Theory: Max: ~ 204 (102*2 = 204 Connections) * 80% ~ 160 Connections
# Documentation: https://docs.aws.amazon.com/documentdb/latest/developerguide/limits.html#limits.instance
resource "aws_cloudwatch_metric_alarm" "documentdb_connection" {
alarm_name = "xxxxxxxxxxxxxxxxxxxxxxxx-limitConnections"
evaluation_periods = 2
comparison_operator = "GreaterThanOrEqualToThreshold"
threshold = 160
alarm_description = "Dectect DocumentDB reach over 80% connection during 2 minutes"
metric_name = "DatabaseConnections"
period = 60
statistic = "Maximum"
namespace = "AWS/DocDB"
unit = "Count"
actions_enabled = true
alarm_actions = []
dimensions = {
DBClusterIdentifier = "xxxxxxxxxxxxxxxxxxxxxxxx"
}
}
resource "aws_cloudwatch_metric_alarm" "documentdb_cpu" {
alarm_name = "xxxxxxxxxxxxxxxxxxxxxxxx-CPUUtilization"
evaluation_periods = 5
comparison_operator = "GreaterThanThreshold"
threshold = 80
alarm_description = "The percentage of CPU used by an instance over 80% during 5 minutes"
metric_name = "CPUUtilization"
period = 60
statistic = "Average"
namespace = "AWS/DocDB"
unit = "Percent"
actions_enabled = true
alarm_actions = []
dimensions = {
DBClusterIdentifier = "xxxxxxxxxxxxxxxxxxxxxxxx"
}
}
# Usage: Detect the lower memory event of DocumentDB
# Theory: DocumentDB with type t3.medium will have 4GB Memory = 4*1024 = 4096 (Byte)
# Expected not lower than 90% Memory = 90% * 4096 ~ 3700 (Byte)
# Threshold ~ 4096 - 3700 ~ 400 (Byte)
resource "aws_cloudwatch_metric_alarm" "documentdb_memory" {
alarm_name = "xxxxxxxxxxxxxxxxxxxxxxxx-freeableMemory"
evaluation_periods = 5
comparison_operator = "LessThanOrEqualToThreshold"
threshold = 400
alarm_description = "The percentage of memory used by an instance over 90% during 5 minutes"
metric_name = "FreeableMemory"
period = 60
statistic = "Maximum"
namespace = "AWS/DocDB"
unit = "Bytes"
actions_enabled = true
alarm_actions = []
dimensions = {
DBClusterIdentifier = "xxxxxxxxxxxxxxxxxxxxxxxx"
}
}You are on set, you can run Terraform to apply this change, with non’t alarm action set. We will continue provision it when we reach to create SNS and Chatbot
Send alert to your mail and slack with SNS
In the last step, you need to send your alarm event into somewhere to aware with you about the threshold is higher or lower than expectation range.
With AWS, They have Simple Notification Service (SNS) give us a tool to send the notification into that service via Pub/Sub methodology. It means you can send alert as publisher event into SNS and all subscription which subscribe with topics will receive the alert.
In this practical, I try to handle both of them, Email and Chatbot because in simple protocol email is one of basic type, you can try to create and put that into one of subscription of SNS. In other ways, AWS has Chatbot as ChatOps service that permit us connect your AWS with Slack or Team to distribute the alert.
Turn back in Terraform, we will figure out how set action_alarm with SNS. Explore SNS and Chatbot with Terraform at Resource: aws_sns_topic and Resource: aws_chatbot_slack_channel_configuration
# IAM Policy for SNS
data "aws_iam_policy_document" "default" {
  policy_id = "__default_policy_ID"

  statement {
    actions = [
      "SNS:Subscribe",
      "SNS:SetTopicAttributes",
      "SNS:RemovePermission",
      "SNS:Receive",
      "SNS:Publish",
      "SNS:ListSubscriptionsByTopic",
      "SNS:GetTopicAttributes",
      "SNS:DeleteTopic",
      "SNS:AddPermission",
    ]

    condition {
      test     = "StringEquals"
      variable = "AWS:SourceOwner"

      values = [
        local.account_id
      ]
    }

    effect = "Allow"

    principals {
      type        = "AWS"
      identifiers = ["*"]
    }

    resources = [
      aws_sns_topic.infrastruture.arn,
    ]

    sid = "__default_statement_ID"
  }
}

# SNS Definition
resource "aws_sns_topic" "infrastruture" {
  name            = "${local.prefix}-cloudwatch-alarm-db"
  delivery_policy = <<EOF
{
  "http": {
    "defaultHealthyRetryPolicy": {
      "minDelayTarget": 20,
      "maxDelayTarget": 20,
      "numRetries": 3,
      "numMaxDelayRetries": 0,
      "numNoDelayRetries": 0,
      "numMinDelayRetries": 0,
      "backoffFunction": "linear"
    },
    "disableSubscriptionOverrides": false,
    "defaultThrottlePolicy": {
      "maxReceivesPerSecond": 1
    }
  }
}
EOF
}

resource "aws_sns_topic_policy" "infrastructure" {
  arn    = aws_sns_topic.infrastruture.arn
  policy = data.aws_iam_policy_document.default.json
}

# SNS Subscription
resource "aws_sns_topic_subscription" "email" {
  endpoint  = "xeus.n@xyz.zyx"
  protocol  = "email"
  topic_arn = aws_sns_topic.infrastruture.arn
}
With Chatbot, we can try define like this
# Get the exist chatbot which one provided previous the implementation
data "aws_chatbot_slack_workspace" "default" {
  slack_team_name = "xyzbcd"
}

# Get the role definition for AWS Chatbot Role
data "aws_iam_role" "chatbot" {
  name = "AWSChatbot-rule"
}

# Configure channel for AWS Chatbot with created channel
resource "aws_chatbot_slack_channel_configuration" "infrastructure" {
  configuration_name    = "infra-warning-bot"
  iam_role_arn          = data.aws_iam_role.chatbot.arn
  slack_team_id         = data.aws_chatbot_slack_workspace.default.slack_team_id
  slack_channel_id      = local.tr_infrastructure_warning_channel_id
  guardrail_policy_arns = ["arn:aws:iam::aws:policy/ReadOnlyAccess"]
  logging_level         = "INFO"
  sns_topic_arns        = [aws_sns_topic.infrastruture.arn]
}
With AWSChatbot-rule definition can be like. But you can explore more at AWS Documentation - IAM policies for AWS Chatbot
{
    "Version": "2012-10-17",
    "Statement": [
        {
            "Action": [
                "cloudwatch:Describe*",
                "cloudwatch:Get*",
                "cloudwatch:List*"
            ],
            "Effect": "Allow",
            "Resource": "*"
        }
    ]
}
Now you can turn back into your alarm, at alarm_action, you can change that into sns_topic like this
resource "aws_cloudwatch_metric_alarm" "rds_cpu" {
  alarm_name          = "xxxxxxxxxxxxxxxxxxxxxxxx-highCPU"
  comparison_operator = "GreaterThanOrEqualToThreshold"
  evaluation_periods  = 3
  metric_name         = "CPUUtilization"
  namespace           = "AWS/RDS"
  period              = 600
  statistic           = "Maximum"
  threshold           = 80
  alarm_description   = "Database instance CPU above threshold"
  actions_enabled     = true
  alarm_actions       = [aws_sns_topic.infrastruture.arn]

  dimensions = {
    DBInstanceIdentifier = "xxxxxxxxxxxxxxxxxxxxxxxx"
  }
}
In the end, run Terraform workflow and you can set up full stack monitoring stack from Observability to alert system with using total AWS Services.
Note
In the Chatbot, you need to provide
Channelid andslackworkspace id, but to easily you need to manual authentication your slack with AWS in Chatbot portal. Afterward, you can try to setup automatically new channel with workspace retrieve from datasourceslack. One more thing, in channel where used for alerting, you need to addAWS Appinto this slack channel to gain access from Chatbot to your Slack as well.
Success
Now you can test and try to see your implementation actual work with couple button inside Chatbot, you will receive test message in both email and slack because It’s trigger SNS to send message, and any subscription inside SNS Topics will receive the notification. 😏
Conclusion

Success
That @all for this weekend, hope you find well with useful information and how to set up your monitoring stack in AWS Cloud. I just catch again the motivate when write the blog and drop some things for community, I have some different feeling with kinda stuff with my career, BTW, I will be strong and bring the high quality contents afterward. Hope so anything will be fine
Quote
Like I told above, I will not follow discipline into blog every week in this month because couple of thing in work, and I just let my brain chill out after many thing disaster. I think I will try to write a couple normal article about tech, not try hard like this one. So, Stay safe, learn more thing and see you on next weekend. Bye Bye 👋