What is Azure Monitor ?
Reference resource
Info
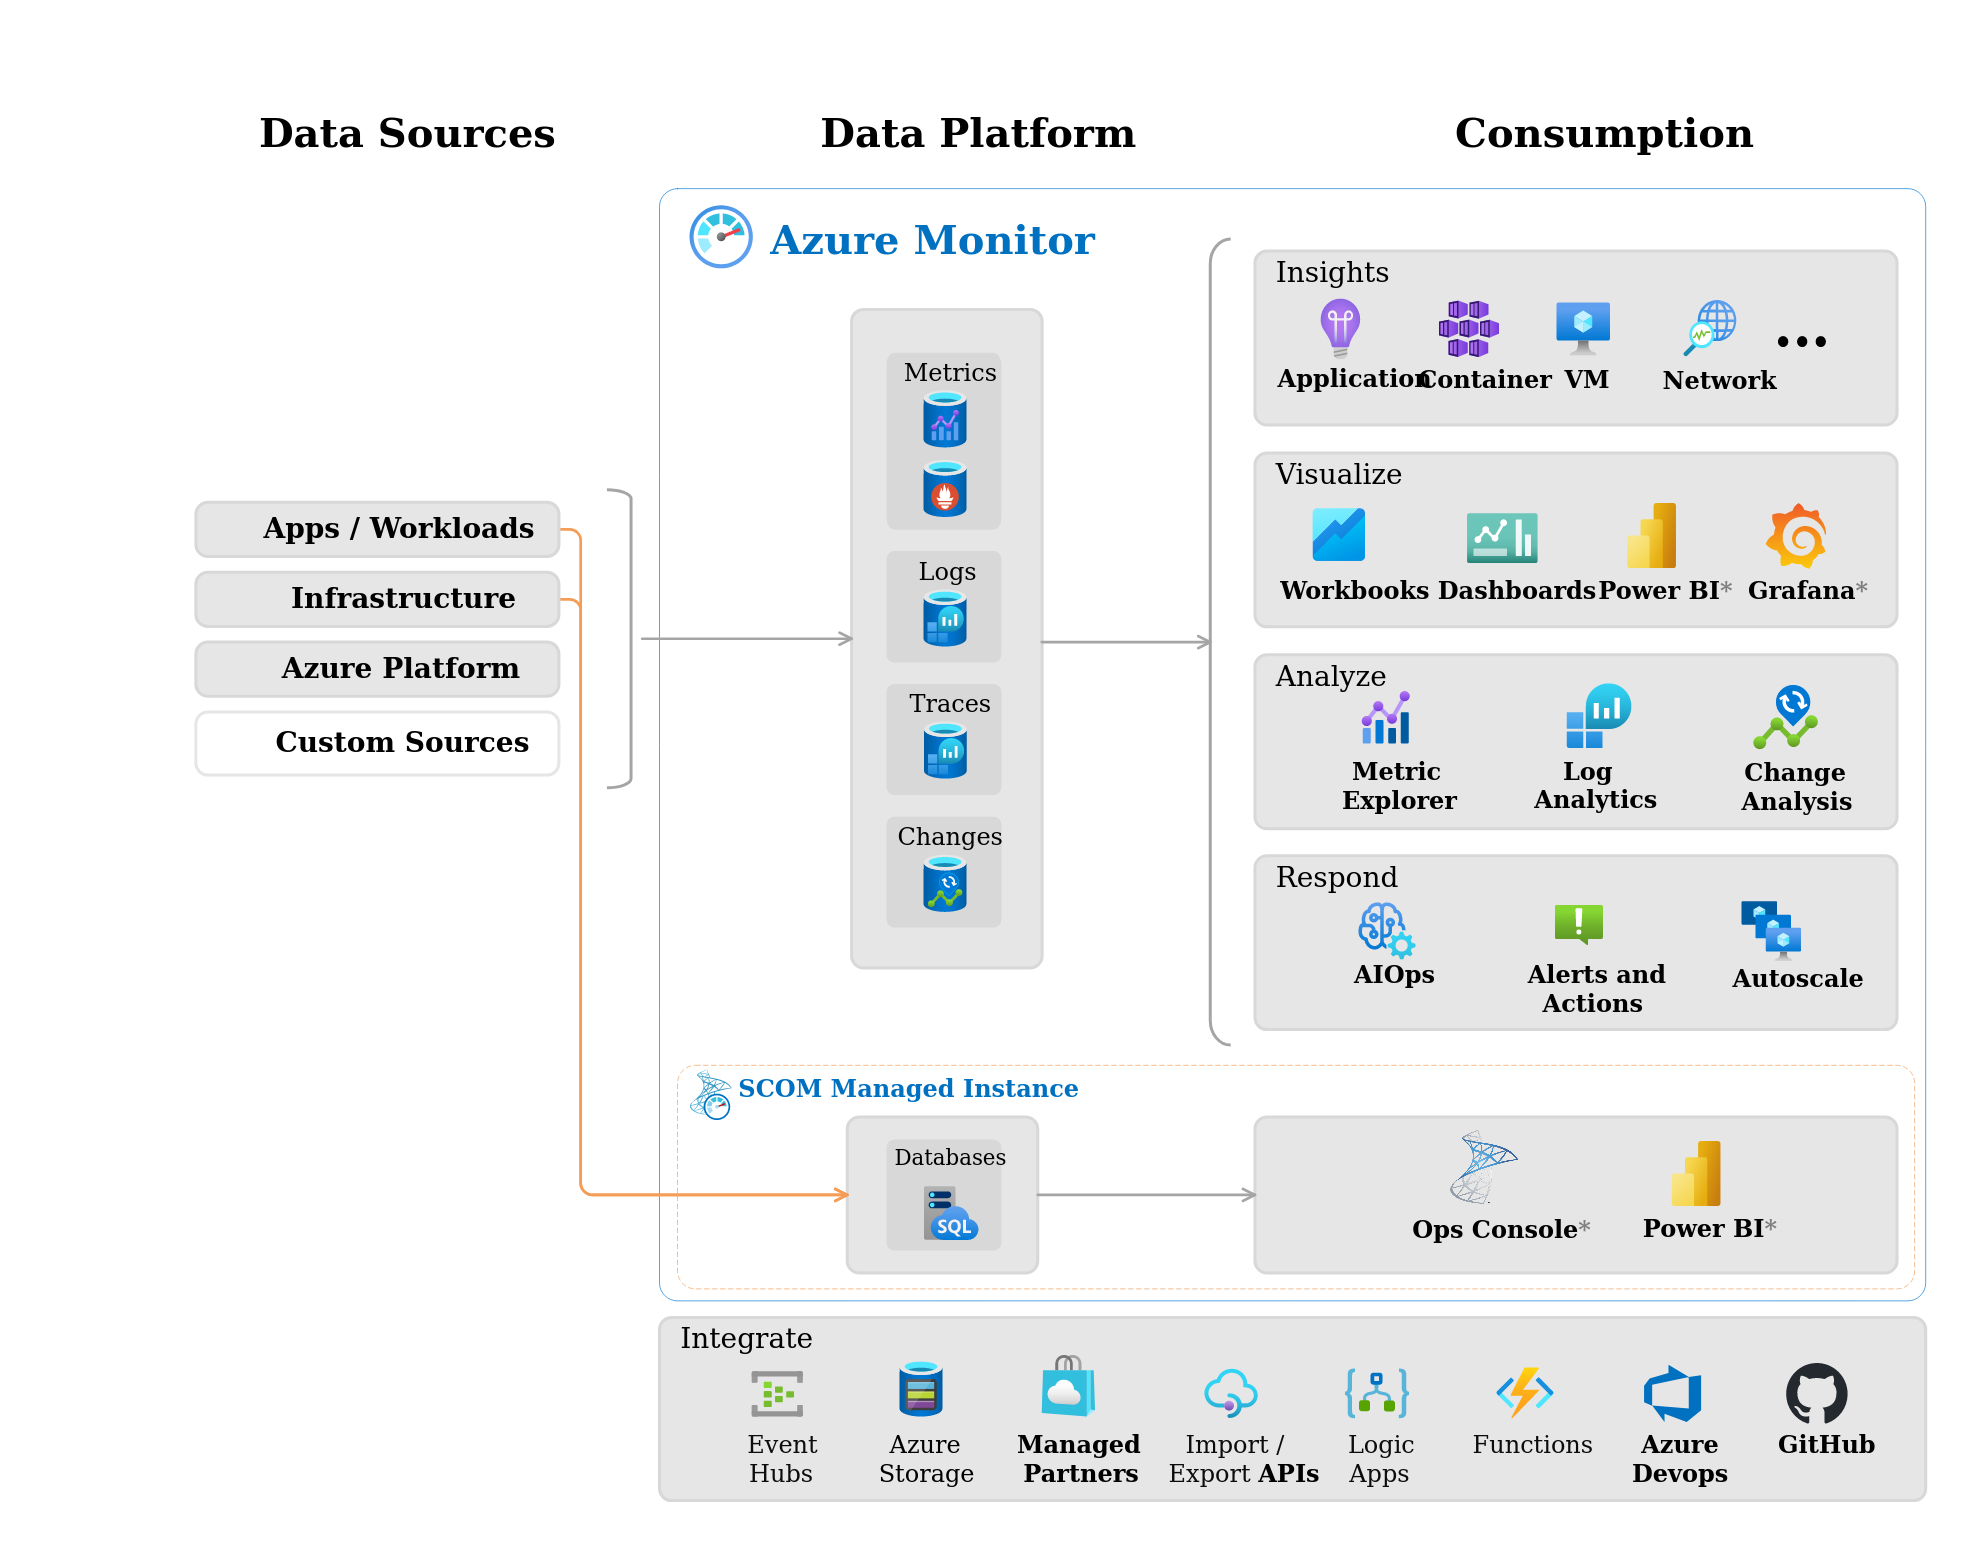
Azure Monitor is a comprehensive solution that collects, analyzes, and responds to telemetry data from both on-premises and cloud environments. The service features help you understand how your applications are performing. You can use Azure Monitor to proactively identify issues that affect your apps and resources, and take action to maximize their availability and performance.
Azure Monitor provides features and capabilities in three areas:
- Monitor and visualize metrics
- Query and analyze logs
- Set up alerts and actions
Components
Reference resource
You can figure out the monitor is last wall which reveal all the performance and health of your applications which one work on Azure, It work perfectly with Azure to provide robust monitoring and diagnostics solutions
- The monitoring and diagnostic services offered in Azure are divided into broad categories such as Core, Application, Infrastructure, and Shared Capabilities.
- Data stores in Azure Monitor hold your metrics and logs
- Various monitoring sources provide Azure Monitor with the metrics and logs data to analyze. These sources can include your Azure subscription and tenant, your Azure service instances, your Azure resources, data from your applications, and more.
- Azure Monitor Insights performs different functions with the collected data, including analysis, alerting, and streaming to external systems.
Metrics and Logs
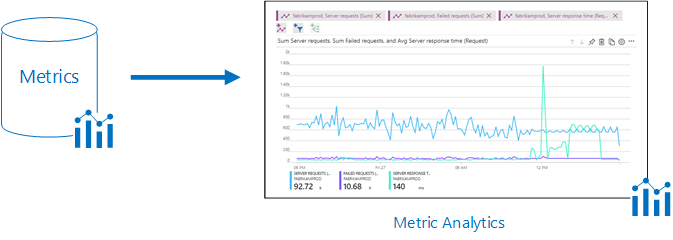
When work with Azure Monitor metrics in the Azure portal.
- Usually, Metrics will display on overview page for the resource in Azure Portal
- Use Azure Monitor metrics explorer to view the metrics for your Azure services and resources.
- Select any graph for a resource to open the associated metrics data in metrics explorer.
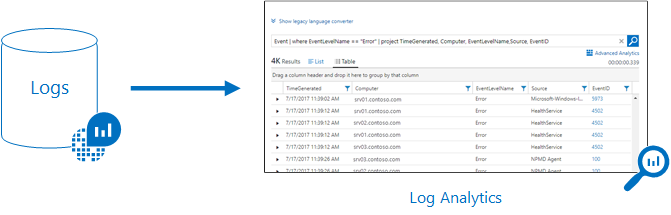
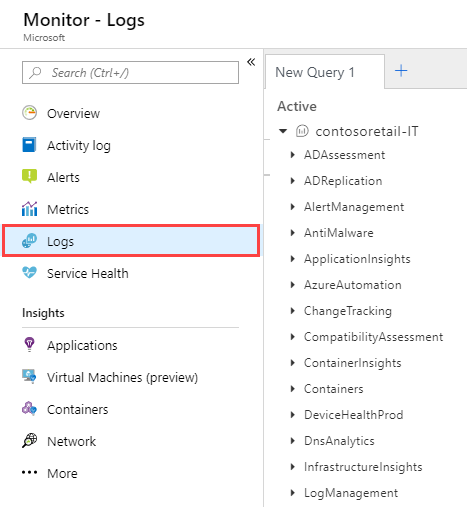
When work with Azure Monitor Logs (Log Analytics) in the Azure portal
- Log data collected by Azure Monitor is stored in Log Analytics.
- Log Analytics includes a rich query language to help you quickly retrieve, consolidate, and analyze your collected data.
- You can work with Log Analytics to create and test queries. Use the query results to directly analyze the data, save your queries, visualize the data, and create alert rules.
- Azure Monitor uses a version of the Data Explorer query language. The language is suitable for simple log queries, but also includes advanced functionality like aggregations, joins, and smart analytics.
Identify monitoring data and tiers
Reference Resource
Azure Monitor can collect data from various sources
- Your application
- The operating system
- Services and resources used by your application
- The platform that supports your application
Azure Monitor collects different categories of data, such as
- Begins collecting data as soon as you create your Azure subscription and add resources
- When create or modify resources, this data will store in activity log
- Performance data about resources, along with the amount of resources consumed, is stored as Metrics
- Extend the data you’re collecting by enabling diagnostics and adding Azure Monitor Agent to compute resources. By extending your data sources, you can collect data for the internal operation of the resources.
- Azure Monitor Agent also lets you configure different data sources to collect logs and metrics from Windows and Linux guest operating systems.
- Azure Monitor can collect log data from any REST client by using the Data Collector API. The Data Collector API lets you create custom monitoring scenarios and extend monitoring to resources that don’t expose data through other sources.
The tiers of monitoring data that are collected by Azure Monitor: Application, Guest OS, Azure resource, Azure subscription, and Azure tenant
Activity log events
Reference resource
Info
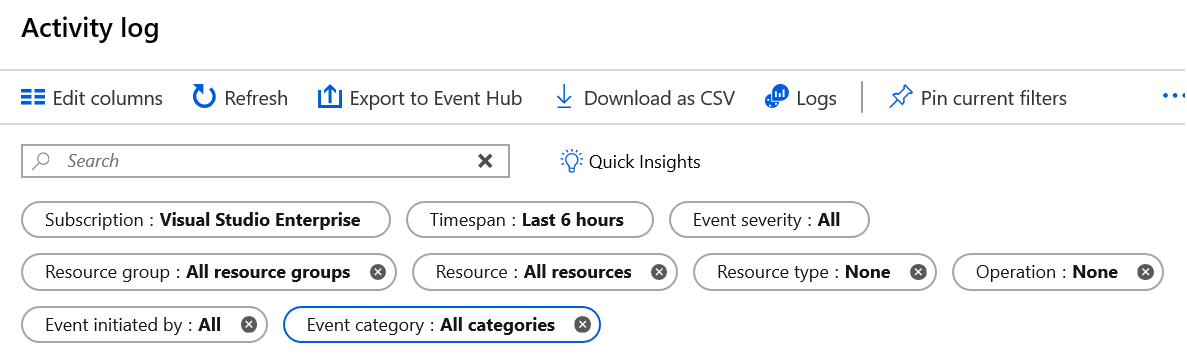
The Azure Monitor activity log is a subscription log that provides insight into subscription-level events that occur in Azure. Events can include a range of data from Azure Resource Manager operational data to updates on Azure service health events.
Note
- Activity logs are kept for 90 days, You can query for any range of dates in an activity log, as long as the starting date isn’t more than 90 days in the past.
- You can retrieve events from your activity logs by using the Azure portal, the Azure CLI, PowerShell cmdlets, and the Azure Monitor REST API.
You can follow the article, for further more about Query the activity log
LAB: https://learn.microsoft.com/en-us/training/modules/configure-azure-monitor/8-simulation-monitor
Question
Which category includes information to help track NSGs and Azure Resource Manager? Administrative
For further more about monitoring, read and practice documentation from Azure Monitoring Summary
Log Analytics
Info
Log Analytics is a tool for Azure Monitor that’s available in the Azure portal. You can use Log Analytics to edit and run log queries for the data collected in Azure Monitor Logs
Reference resource
Characteristics of Log Analytics in Azure Monitor
-
Offers query features and tools that help you answer virtually any question about your monitored configuration.
-
Supports the Kusto Query Language (KQL), including:
- Search and sort by value, time, property state, and more
- Join data from multiple tables
- Aggregate large sets of data
- Perform intricate operations with minimal code
-
Can use Log Analytics to complete detailed analysis and problem solving.
Tip
For Log Analytics, Azure offer you create Log Analytics workspace, which is the basic management environment for Azure Monitor Logs.
Log Analytics workspace, configure the following parameters:
- Name
- Subscription
- Resource Group
- Region
- Pricing
Tip
Like we refer above, you can use
KQLto querying and analytics log in Azure monitor
Important thing for proficient in use KQL, you need to know about Structure Log Analytics queries
Describe about structure a KQL log query, like
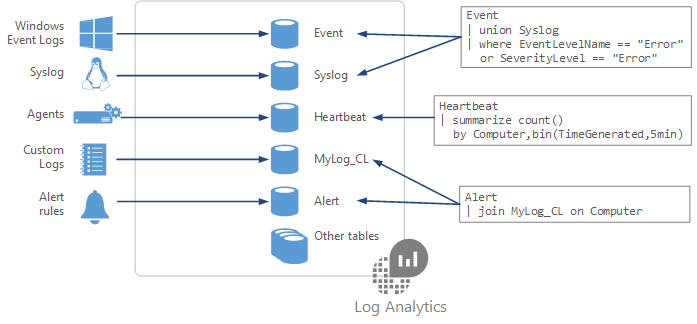
- Each of your selected data sources and solution stores its data in dedicated tables in your Log Analytics workspace.
- Documentation for each data source and solution includes the name of the data type that it creates and a description of each of its properties.
- The basic structure of a query is a source table followed by a series of commands (referred to as operators).
- A query can have a chain of multiple operators to refine your data and perform advanced functions.
- Each operator in a query chain begins with a pipe character
|. - Many queries require data from a single table only, but other queries can use various options and include data from multiple tables.
Specially, you need to remember some specify operators which used by KQL
- The
countoperator to discover the number of records in an input record set. - Use the
topoperator to see the first N records of your input record set, sorted by your specified columns - Use the
whereoperator to filter your table to the subset of rows that match the supplied predicate value. - Use the
summarizeoperator to create a table that aggregates the content of the input record set based on your specifications. - You can build the query like a chain, It means you can use both
whereandsummarizecommand with|and doing something with nested purpose
Question
How does Azure Monitor organize log data? Use tables
Note
Azure Monitor log query can pin chart with 14 days for maximum
Summaries and resources: https://learn.microsoft.com/en-us/training/modules/configure-log-analytics/7-summary-resources
More about kusto (kql) language
- Create basic Azure Monitor log queries to extract information from log data
- Exercise - Create basic Azure Monitor log queries to extract information from log data
- Summary use KQL extract monitoring logs
Alert
Reference resource
- Explore the different alert types that Azure Monitor supports
- Use metric alerts for alerts about performance issues in your Azure environment
- Use log alerts to alert on events in your application
- Use activity log alerts to alert on events within your Azure infrastructure
- Use action groups and alert processing rules to send notifications when an alert is fired
- Exercise -Use an activity log alert and an action group to notify users about events in your Azure infrastructure
- Exercise - Use metric alerts to alert on performance issues in your Azure environment
Info
Azure Monitor can perform any of the following actions:
- Send an email
- Send an SMS message
- Create an Azure app push notification
- Make a voice call to a number
- Call an Azure function
- Trigger a logic app
- Send a notification to a webhook
- Create an ITSM ticket
- Use a runbook (to restart a VM or scale a VM up or down)
Info
You can use alert processing rules to:
- Suppress notifications during planned maintenance windows.
- Implement management at scale, by specifying commonly used logic in a single rule, instead of having to set it consistently in all your alert rules.
- Add an action group to all alert types.
Data types in Azure Monitor
Three signal types that you can use to monitor your environment:
- Metric alerts provide an alert trigger when a specified threshold is exceeded. For example, a metric alert can notify you when CPU usage is greater than 95 percent.
- Activity log alerts notify you when Azure resources change state. For example, an activity log alert can notify you when a resource is deleted.
- Log alerts are based on things written to log files. For example, a log alert can notify you when a web server has returned a number of 404 or 500 responses.
Composition of an alert rule
Composition of an alert rule remains the same.
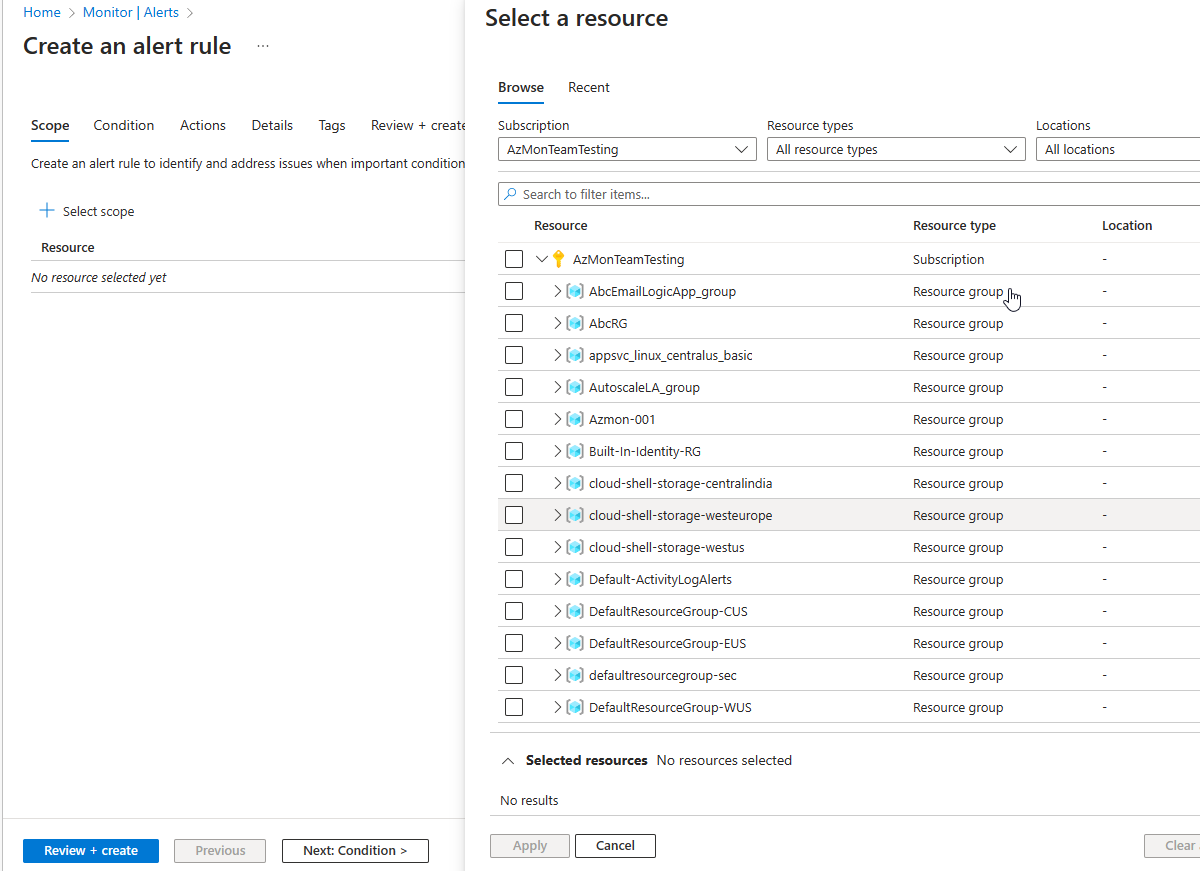
- RESOURCE
- The target resource for the alert rule. You can assign multiple target resources to a single alert rule. The type of resource defines the available signal types.
- CONDITION
- The signal type used to assess the rule. The signal type can be a metric, an activity log, or logs. There are others, but this module doesn’t cover them.
- The alert logic applied to the data that’s supplied via the signal type. The structure of the alert logic changes depending on the signal type.
- ACTIONS
- The action, like sending an email, sending an SMS message, or using a webhook.
- An action group, which typically contains a unique set of recipients for the action.
- ALERT DETAILS
- An alert name and an alert description that specify the alert’s purpose.
- The severity of the alert if the criteria or logic test evaluates
true. The five severity levels are:- 0: Critical
- 1: Error
- 2: Warning
- 3: Informational
- 4: Verbose
Scope
Can create alert rules for these items and more:
- Metric values
- Log search queries
- Activity log events
- Health of the underlying Azure platform
- Tests for website availability
Manage alert rules
Note
With Azure Monitor, you can specify one or more alert rules and enable or disable them, as needed.
Alert summary view
The alert page shows a summary of all alerts. You can apply filters to the view by using one or more of the following categories: subscriptions, alert condition, severity, or time ranges. The view includes only alerts that match these criteria.
Alert condition
The system sets the alert condition.
- When an alert fires, the alert’s monitor condition is set to Fired.
- After the underlying condition that caused the alert to fire clears, the monitor condition is set to Resolved.
When would you use metric alerts?
Info
You can use metric alerts to achieve regular threshold monitoring of Azure resources. Azure Monitor runs metric alert trigger conditions at regular intervals. When the evaluation is true, Azure Monitor sends a notification. Metric alerts are stateful, and Azure Monitor will send a notification only when the prerequisite conditions are met.
Composition of a metric alert
Use static threshold metric alerts
Info
Static metric alerts are based on simple static conditions and thresholds that you define. With static metrics, you specify the threshold that’s used to trigger the alert or notification.
Use dynamic threshold metric alerts
Info
Dynamic metric alerts use machine-learning tools that Azure provides to automatically improve the accuracy of the thresholds defined by the initial rule.
You’ll need to define two more parameters for dynamic metrics
- The look-back period defines how many previous periods need to be evaluated
- The number of violations expresses how many times the logic condition has to deviate from the expected behavior before the alert rule fires a notification
Understand dimensions
Info
Azure Monitor supports dimensions, which enable monitoring data to be supplied from multiple target instances. You can use dimensions to define one metric alert rule and have it applied to multiple related instances
Note
You can define the dimensions by naming each target instance specifically, or you can define the dimensions by using the asterisk (*) wildcard, which uses all available instances.
Scale metric alerts
Azure Monitor supports creating metric alerts that, like dimensions, monitor multiple resources. Scaling is currently limited to Azure virtual machines. However, a single metric alert can monitor resources in one Azure region.
Creating scaling metric alert rules to monitor multiple resources is no different than creating any other metric alert rule; you just select all the resources that you want to monitor.
Like dimensions, a scaling metric alert is individual to the resource that triggered it.
When to use log alerts
Info
Log alerts use log data to assess the rule logic and, if necessary, trigger an alert. This data can come from any Azure resource: server logs, application server logs, or application logs.
How log alerts work
Log alerts behave in a slightly different way than other alert mechanisms. The first part of a log alert defines the log search rule. The rule defines how often it should run, the time period under evaluation, and the query to be run.
When a log search evaluates as positive, it creates an alert record and triggers any associated actions.
Composition of log search rules
Include : Log query, time period, frequency, and threshold
Info
Log search results are one of two types: number of records or metric measurement.