doc.crds.dev: Find and Parse API Scheme of specific URL CRDs repository
Kubernetes Q/A Collection
Can use volume with cronjobs?
Purpose
This note will content the thing which finding on working progress with K8s. Just take note and link for resolving the problem. Find out detail if it has unique directory
Cronjobs --> Create Jobs (Trigger by scheduled) --> Pod : In this situation, Pod in K8s can used the volume and mount succeed when the script running. But if you applied it with pods, it will not, your command will run faster than mount progress. Checked it in this link
Pods are not directly evicted due to high CPU pressure or usage alone. Instead, Kubernetes relies on CPU throttling mechanisms to manage and limit a pod’s CPU usage, ensuring fair resource sharing among pods on the same node.
While high CPU usage by a pod can indirectly contribute to resource pressure and potentially lead to eviction due to memory or other resource shortages, CPU throttling is the primary mechanism used to manage CPU-intensive workloads
The answer is yes, absolutely because we can approach topologySpreadConstraints for tackle this feature in Kubernetes, from version 1.19, it’s pretty coolest. Explore more at Kubernetes - Pod Topology Spread Constraints
Info
”You can use topology spread constraints to control how Pods are spread across your cluster among failure-domains such as regions, zones, nodes, and other user-defined topology domains. This can help to achieve high availability as well as efficient resource utilization.”
From Kubernetes
Example:
---apiVersion: v1kind: Podmetadata: name: example-podspec: # Configure a topology spread constraint topologySpreadConstraints: - maxSkew: <integer> minDomains: <integer> # optional topologyKey: <string> whenUnsatisfiable: <string> labelSelector: <object> matchLabelKeys: <list> # optional; beta since v1.27 nodeAffinityPolicy: [Honor|Ignore] # optional; beta since v1.26 nodeTaintsPolicy: [Honor|Ignore] # optional; beta since v1.26 ### other Pod fields go here
This configuration is pretty simple but truly important for Kubernetes to pull image from private registry - One of best practice in enterprise Kubernetes Platform or container platform. Explore more at Pull an Image from a Private Registry
With kubectl you will have two opts to create the registry-cred, including
First of all, you can create from exist file
# You can create the docker-cred, usually at $HOME/.docker/config.json# Use command: docker login, now you can cred secret by that filekubectl create secret generic <secret-name> \ --from-file=.dockerconfigjson=<path/to/.docker/config.json> \ --type=kubernetes.io/dockerconfigjson# Or usekubectl create secret docker-registry <secret-name> \ --from-file=.dockerconfigjson=path/to/.docker/config.json
Second, you can use the authorization by own kubectl
# Delete a pod using the type and name specified in pod.jsonkubectl delete -f ./pod.json# Delete a pod with no grace periodkubectl delete pod unwanted --nowkubectl delete pods <pod> --grace-period=0# Delete pods and services with same names "baz" and "foo"kubectl delete pod,service baz foo
Edit YAML manifest
kubectl can help you directly change manifest on your shell. If you Linux or macos user, you can use nano or vim to use feature
# Edit the service named docker-registrykubectl edit svc/docker-registry # Use an alternative editorKUBE_EDITOR="nano" kubectl edit svc/docker-registry
When you hit to complete button, your workload or resource will change immediately
Health check and interact with cluster, node and workload
Use the events command for detect what happen occur on cluster node
# List Events sorted by timestampkubectl get events --sort-by=.metadata.creationTimestamp# List all warning eventskubectl events --types=Warning
If the status of workload are not available or running, you can use describe for verbose check workload
When the problem does not come up from workload, you can check log for extract more information
# dump pod logs (stdout)kubectl logs my-pod# dump pod logs (stdout) for a previous instantiation of a container. Usually use for crashloopbackkubectl logs my-pod --previous# dump pod container logs (stdout, multi-container case) for a previous instantiation of a containerkubectl logs my-pod -c my-container --previous# stream pod logs (stdout) kubectl logs -f my-pod
If you check any situation on workload, especially pods, container without results, you can return to check resources usage on cluster.
# Show metrics for all nodeskubectl top node # Show metrics for a given nodekubectl top node my-node# For total overview, you resource-capacity plugin# print information includes quantity available instead of percentage usedkubectl resource-capacity -a# print information includes resource utilization, pods in outputkubectl resource-capacity --until -p
kubectl can help you disable or manipulation node with command
# Mark my-node as unschedulablekubectl cordon my-node# Drain my-node in preparation for maintenancekubectl drain my-node# Mark my-node as schedulablekubectl uncordon my-node
Tips
For explore more, you can do lots of things with kubectl. To read and understand command, you should use manual with --help flag
Install CRD
When you want to install extension API for Kubernetes, in usual Kubernetes provides us the standard called CRD (Custom Resources Definitions). But in some situations, you apply the CRD get over the most bytes able for created and cause the error
k apply -f rayjobs-crd.yaml
The CustomResourceDefinition "rayjobs.ray.io" is invalid: metadata.annotations: Too long: must have at most 262144 bytes
Do not removing statefulset workload, it will scale down to 0 and not bring up anymore. Instead of just removing pods, It will help the pods restart base on statefulset strategy
Rollout statefulset is not work when status of statefulset is completed
Deleting pods in statefulset will not remove associated volume
Note
Deleting the PVC after the pods have terminated might trigger deletion of the backing Persistent Volumes depending on the storage class and reclaim policy. You should never assume ability to access a volume after claim deletion.
Note: Use caution when deleting a PVC, as it may lead to data loss.
Complete deletion of a StatefulSet
To delete everything in a StatefulSet, including the associated pods, you can run a series of commands similar to the following*
You can see, cronjob is scheduled workload of Kubernetes which trigger on set-time for executing specify job. But sometimes, on during work time, your test job shouldn’t work, therefore you will concert about suspend state of jobs. You can update state with command
k patch -n <namespace> cronjobs.batch <cronjobs-name> -p '{"spec": {"suspend": true}}'
Enable again by change true⇒false
k patch -n <namespace> cronjobs.batch <cronjobs-name> -p '{"spec": {"suspend": false}}'
Furthermore, you can use patch for multiple purpose
Update a container’s image
Partially update a node
Disable a deployment livenessProbe using json patch
Update a deployment’s replica count
Updating resources
You can handle graceful restart, rollback version with roolout command
# Graceful restart deployments, statefulset and deamonsetk rollout restart -n <namespace> <type-workload>/<name># Rollback versionkubectl rollout undo <type-workload>/<name>kubectl rollout undo <type-workload>/<name> --to-revision=2# Check the rollout statuskubectl rollout status -w <type-workload>/<name>
Kubernetes has some values with help to distinguish service with each others, specify identifying attributes of objects, attach arbitrary non-identifying metadata to objects, …
Label
Annotations
And you can update that with kubectl via label and anotation command
# Add a Labelkubectl label pods my-pod new-label=awesome# Remove a labelkubectl label pods my-pod new-label- # Overwrite an existing valuekubectl label pods my-pod new-label=new-value --overwrite # Add an annotationkubectl annotate pods my-pod icon-url=http://goo.gl/XXBTWq # Remove annotationkubectl annotate pods my-pod icon-url-
Next, you can update autoscale for deployment by command autoscale
kubectl autoscale deployment foo --min=2 --max=10
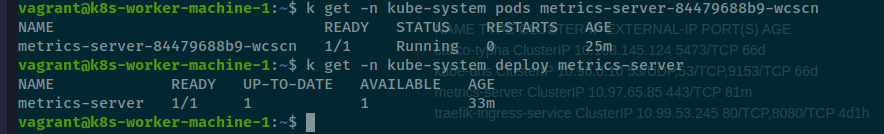
Setup metrics-server
Metrics server will part if you self-hosted your kubernetes, It means you need learn how setup metrics-server , and this quite very easily. Read more about metrics-server at
Or you can use helm to release metrics-server chart at helm
# Add repo to your clusterhelm repo add metrics-server https://kubernetes-sigs.github.io/metrics-server/# Create the metrics with find the helm-template inside repohelm upgrade --install metrics-server metrics-server/metrics-server
Troubleshoot
Warning
Your metrics-server will stuck, because it meet problem to not authentication tls inside them with kube-apiserver
But don’t worry about it, you can bypass this via some trick. Read more about solution at
Therefore, the solution will use edit command of kubectl to edit manifest of deployments kube-server, you can do like this
# First of all, you can configure your editor to nano (Optional), you can't do this step if you prefer vimexport KUBE_EDITOR="nano"# Use edit to change manifest of deploymentkubectl edit deployments -n kube-system metrics-server
Next, you need scroll to args of container metrics-server, you can change them into
      - args:
        - --cert-dir=/tmp
        - --secure-port=10250
        - --kubelet-preferred-address-types=InternalIP,ExternalIP,Hostname
        - --kubelet-use-node-status-port
        - --metric-resolution=15s
        - --kubelet-insecure-tls=true # This will help you bypass authentication
At the end, your metrics-server will restart and running after 30s
However, if you use helm to deploy your metric-server, you can easier patch it with add more --set option.
Note
Because args is a list, so you need add the --set with Curly Braces {}, this syntax tells Helm that the value is a list (array)
Probes have a number of fields that you can use to more precisely control the behavior of startup, liveness and readiness checks
initialDelaySeconds: Number of seconds after the container has started before startup, liveness or readiness probes are initiated. Defaults to 0 seconds. Minimum value is 0.
periodSeconds: How often (in seconds) to perform the probe. Default to 10 seconds. The minimum value is 1
timeoutSeconds: Number of seconds after which the probe times out. Defaults to 1 second. Minimum value is 1
successThreshold: Minimum consecutive successes for the probe to be considered successful after having failed. Defaults to 1. Minimum value is 1.
failureThreshold: After a probe fails failureThreshold times in a row, Kubernetes considers that the overall check has failed: the container is not ready/healthy/live. Defaults to 3. Minimum value is 1.
terminationGracePeriodSeconds: configure a grace period for the kubelet to wait between triggering a shut down of the failed container, and then forcing the container runtime to stop that container. Default is to inherit the Pod-level value for terminationGracePeriodSeconds (30 seconds if not specified), and the minimum value is 1.
Liveness
Info
Liveness probes determine when to restart a container. For example, liveness probes could catch a deadlock, when an application is running, but unable to make progress.
If a container fails its liveness probe repeatedly, the kubelet restarts the container.
You can set up liveness probe with command configuration
Readiness probes determine when a container is ready to start accepting traffic. This is useful when waiting for an application to perform time-consuming initial tasks, such as establishing network connections, loading files, and warming caches.
If the readiness probe returns a failed state, Kubernetes removes the pod from all matching service endpoints.
Configuration for HTTP and TCP readiness probes also remains identical to liveness probes.
Info
Readiness and liveness probes can be used in parallel for the same container. Using both can ensure that traffic does not reach a container that is not ready for it, and that containers are restarted when they fail.
Note
Readiness probes runs on the container during its whole lifecycle.
Startup
Info
A startup probe verifies whether the application within a container is started. This can be used to adopt liveness checks on slow starting containers, avoiding them getting killed by the kubelet before they are up and running.
If such a probe is configured, it disables liveness and readiness checks until it succeeds.
You can use terraform with manifest to apply this configuration
elastic_snapshotter.tf
# https://www.linkedin.com/pulse/elastic-cloud-kubernetes-eck-quickstart-azure-repository-ajay-singh/resource "kubernetes_secret" "azure_snapshot_secret" { metadata { name = "azure-snapshot-secret" namespace = var.namespace } binary_data = { "azure.client.default.account" = base64encode(var.remote_state.backup_storage_account_name) "azure.client.default.key" = base64encode(var.remote_state.backup_storage_account_key) } depends_on = [ helm_release.elastic_operator ]}# Register the Azure snapshot with the Elasticsearch clusterresource "kubectl_manifest" "elasticsearch_register_snapshot" { yaml_body = <<YAMLapiVersion: batch/v1kind: Jobmetadata: name: ${var.name}-register-snapshot namespace: ${var.namespace}spec: template: spec: containers: - name: register-snapshot image: curlimages/curl:latest volumeMounts: - name: es-basic-auth mountPath: /mnt/elastic/es-basic-auth command: - /bin/sh args:# - -x # Can be used to debug the command, but don't use it in production as it will leak secrets. - -c - | curl -s -i -k -u "elastic:$(cat /mnt/elastic/es-basic-auth/elastic)" -X PUT \ 'https://${var.name}-es-http:9200/_snapshot/azure' \ --header 'Content-Type: application/json' \ --data-raw '{ "type": "azure", "settings": { "client": "default" } }' | tee /dev/stderr | grep "200 OK" restartPolicy: Never volumes: - name: es-basic-auth secret: secretName: ${var.name}-es-elastic-userYAML depends_on = [kubectl_manifest.elasticsearch]}# Create the snapshotter cronjob.resource "kubectl_manifest" "elasticsearch_snapshotter" { yaml_body = <<YAMLapiVersion: batch/v1kind: CronJobmetadata: name: ${var.name}-snapshotter namespace: ${var.namespace}spec: schedule: "0 16 * * 0" concurrencyPolicy: Forbid jobTemplate: spec: template: spec: nodeSelector: pool: infrapool containers: - name: snapshotter image: curlimages/curl:latest volumeMounts: - name: es-basic-auth mountPath: /mnt/elastic/es-basic-auth command: - /bin/sh args: - -c - 'curl -s -i -k -u "elastic:$(cat /mnt/elastic/es-basic-auth/elastic)" -XPUT "https://${var.name}-es-http:9200/_snapshot/azure/%3Csnapshot-%7Bnow%7Byyyy-MM-dd%7D%7D%3E" | tee /dev/stderr | grep "200 OK"' restartPolicy: OnFailure volumes: - name: es-basic-auth secret: secretName: ${var.name}-es-elastic-userYAML depends_on = [kubectl_manifest.elasticsearch_register_snapshot]}resource "kubectl_manifest" "elastic_cleanup_snapshots" { yaml_body = <<YAMLapiVersion: batch/v1kind: CronJobmetadata: name: ${var.name}-cleanup-snapshotter namespace: ${var.namespace}spec: schedule: "@daily" ttlSecondsAfterFinished: 86400 backoffLimit: 3 concurrencyPolicy: Forbid jobTemplate: spec: template: spec: nodeSelector: pool: infrapool containers: - name: clean-snapshotter image: debian:11.7 imagePullPolicy: IfNotPresent volumeMounts: - name: es-basic-auth mountPath: /mnt/elastic/es-basic-auth command: - /bin/sh args: - -c - | # Update and install curl package apt update && apt install -y curl # Get the date base on decision which mark to deleting deletionDate=$(date -d "$date -${var.retention_date} days" +%Y-%m-%d) # Get list elasticsearch snapshot with including in deletion date listElasticSnapshots=$(curl --insecure -X GET "https://elastic:$(cat /mnt/elastic/es-basic-auth/elastic)@${var.name}-es-http:9200/_cat/snapshots/azure" | awk '{print $1}' | grep -e "$deletionDate") # Check if list snapshots are null or not if [ "$listElasticSnapshots" = "" ]; then # Ignore deleted snapshots if no snapshots available echo "Not existing your deletion date" exit 0 else # For remove only or multiple snapshot in deletion date for snapshot in $listElasticSnapshots; do res=$(curl -X DELETE --insecure "https://elastic:$(cat /mnt/elastic/es-basic-auth/elastic)@${var.name}-es-http:9200/_snapshot/azure/$snapshot" 2> /dev/null || echo "false") if [ "$res" != "false" ]; then echo "Deleted $snapshot" else echo "Failed to delete $snapshot" fi done fi restartPolicy: OnFailure volumes: - name: es-basic-auth secret: secretName: ${var.name}-es-elastic-userYAML depends_on = [kubectl_manifest.elasticsearch_register_snapshot]}
Assign Pods to Nodes
You have multiple ways to configuration to assign pods to specific nodes depend on a couple of conditions and it’s make you easier for control cluster, such as
If you setup couple of tags for your node, you can try to retrieve that with nodeSelector for selecting where pods be able to spawn into
In the situation, you wanna add more label and supplied it for your deployment, sure you can use kubectl label to handle that
# Add a Labelkubectl label pods my-pod new-label=awesome# Remove a labelkubectl label pods my-pod new-label-# Overwrite an existing valuekubectl label pods my-pod new-label=new-value --overwrite
View that with get command
kubectl get pods --show-labels
You can modify or set nodeSelector for picking node or resource matching with label
# Assumes the existence of the label: node-role.kubernetes.io/master, and tries to assign the pod to the labelled node.---apiVersion: v1kind: Podmetadata: name: pod-node-selector-simplespec: containers: - command: ["sleep", "3600"] image: busybox name: pod-node-selector-simple-container nodeSelector: node-role.kubernetes.io/master: ""
nodeSelector is the simplest way to constrain Pods to nodes with specific labels. Affinity and anti-affinity expands the types of constraints you can define.
With Node affinity
You will have two types
requiredDuringSchedulingIgnoredDuringExecution: The scheduler can’t schedule the Pod unless the rule is met. This functions like nodeSelector, but with a more expressive syntax.
preferredDuringSchedulingIgnoredDuringExecution: The scheduler tries to find a node that meets the rule. If a matching node is not available, the scheduler still schedules the Pod.
You can specify node affinities using the .spec.affinity.nodeAffinity
You can use the operator field to specify a logical operator for Kubernetes to use when interpreting the rules. You can use In, NotIn, Exists, DoesNotExist, Gt and Lt. Explore more about it at Operators
You can explore more about extend things with affinity
A toleration “matches” a taint if the keys are the same and the effects are the same, and:
the operator is Exists (in which case no value should be specified), or
the operator is Equal and the values should be equal.
The allowed values for the effect field are:
NoExecute
This affects pods that are already running on the node as follows:
NoSchedule
No new Pods will be scheduled on the tainted node unless they have a matching toleration. Pods currently running on the node are not evicted.
PreferNoSchedule
A “preference” or “soft” version of NoSchedule. The control plane will try to avoid placing a Pod that does not tolerate the taint on the node, but it is not guaranteed.
Warning
You can put multiple taints on the same node and multiple tolerations on the same pod. The way Kubernetes processes multiple taints and tolerations is like a filter: start with all of a node’s taints, then ignore the ones for which the pod has a matching toleration; the remaining un-ignored taints have the indicated effects on the pod. In particular,
if there is at least one un-ignored taint with effect NoSchedule then Kubernetes will not schedule the pod onto that node
if there is no un-ignored taint with effect NoSchedule but there is at least one un-ignored taint with effect PreferNoSchedule then Kubernetes will try to not schedule the pod onto the node
if there is at least one un-ignored taint with effect NoExecute then the pod will be evicted from the node (if it is already running on the node), and will not be scheduled onto the node (if it is not yet running on the node).
If you want to explore use-case and example, find out with
In some situations, if you wanna use external resource, such as minio, you can consider to setup couple method of Kubernetes for permitting us do stuff like NAT Network
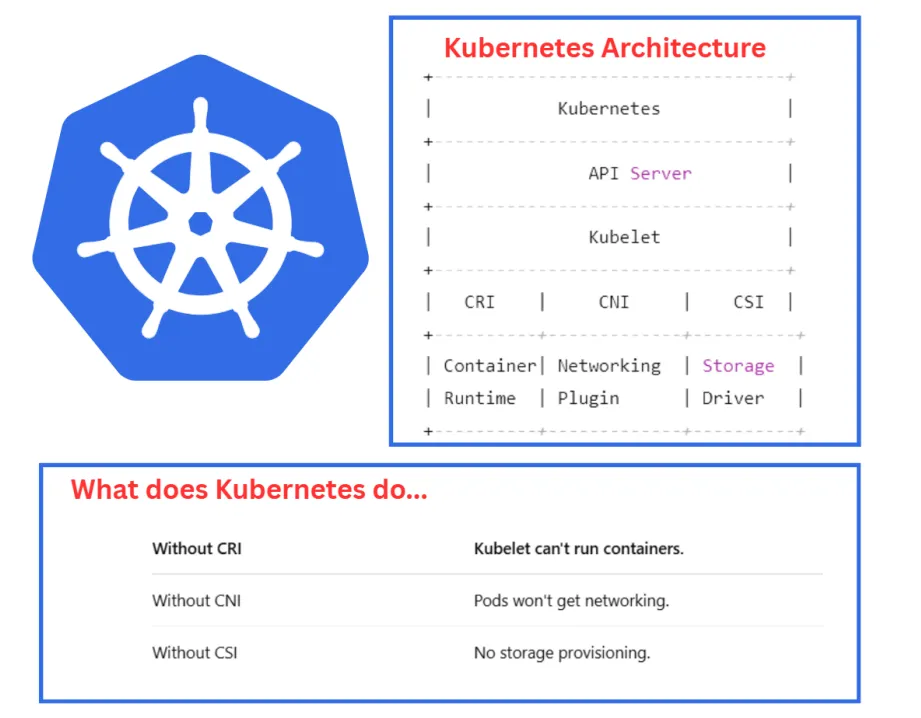
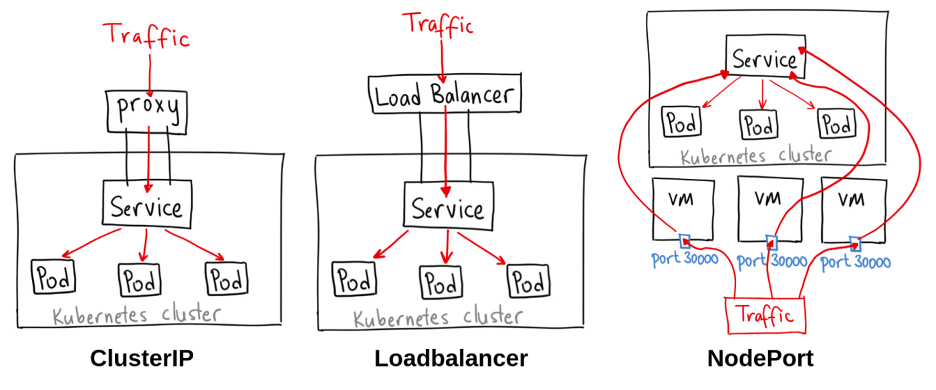
When you inspect kubectl command and kubernetes concept, you will know about network structure inside Kubernetes, including
When you work with Kubernetes, you usually meet Service and Ingress for mapping service but stand behind, It use Endpoint for define how the service make conversation with pod, so we can use this endpoint to define external service. Explore more about at Service without selectors
Info
Services most commonly abstract access to Kubernetes Pods thanks to the selector, but when used with a corresponding set of EndpointSlices objects and without a selector, the Service can abstract other kinds of backends, including ones that run outside the cluster.
Now you can use service to connect directly into your external service via Kubernetes components, you can do with strategies for setup ingress and map DNS for your external service via ingress controller, such as nginx, haproxy, …
If you gracefully update the documentation, you will see Kubernetes that have four service methodology, and one of them is rarely know about it, that’s ExternalName
ExternalName permits to map service to DNS name, you can imagine if you have database with FQDN, you can try to map your service as DNS for resolve this location, similarly CNAME
An External Service pointing to httpbin.org, a simple HTTP request/response service. It’s a valuable tool for testing and debugging as it can simulate various HTTP responses.
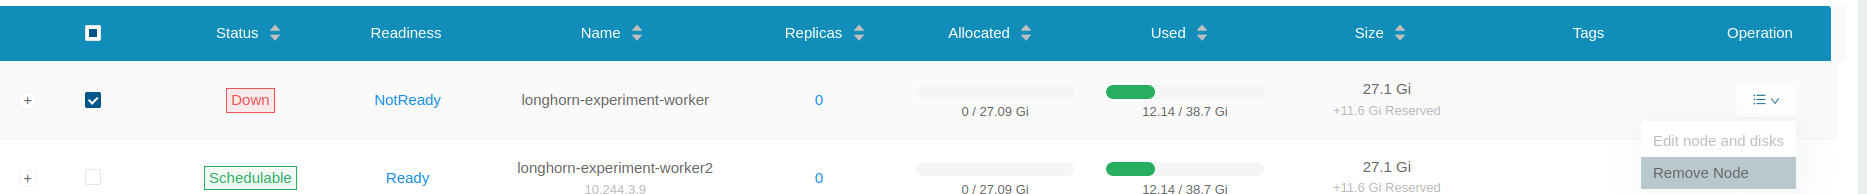
Longhorn maintaining
If you go for double-check longhorn, you should consider to double-check couple of contents
In my experience, I just combine multiple steps from 3 source above and gather this workaround like
Warning
This workaround will only spend for state node with no-disk inside, if the node exist disk and replica, you should follow Harvester - Evicting Replicas From a Disk (the CLI way) to evict all replica for preventing mismatch
Follow the kubectl and daemonset application of longhorn will install again, and your node will be return. If you wanna know about taint, you should read at Kubernetes - Taints and Tolerations
Trick Solution
Quote
Sometimes, the above stuff will not make you feel comfortable, for example, if your node become huge than ever like (200GB Memory Reserve), 100% for sure you don’t wanna touch any in this node for not cause downtime
So that’s why I have experience and give a try to retrieve this trick, but first of all, if you stuck on the step delete longhorn nodes because in couple of situations, your node will stuck with the validation of longhorn-webhook-validator. So you can follow this solution to ignore that stuck at (BUG) Wrong nodeOrDiskEvicted collected in node monitor
Disable the validator through longhorn-webhook-validator, just need to run edit command with kubectl
Now, if you lucky, your node will be erase following the rule updated, but not you can use kubectl or longhorn-ui to delete disk or not what you want. In my situations, I delete longhorn node stuck with command
kubectl delete nodes.longhorn.io <name-node>
If you wanna turn this node back again, It has trick by deleting pods longhorn-manager in that node
# Find it via -o wide to see what manager running in that nodekubectl get pods -o wide | grep -e "longhorn-manager"# Next if you detected it, you can delete this pod for restarting thiskubectl delete pods <name-longhorn-managers>
Now your node will one more time addition again, it’s will install instance-manager for your longhorn node
Lastly, you should regenerate rule again by deleting pods managed it, via command
kubectl delete pod -l app=longhorn-admission-webhook
Turn back again and you will see your node will be added successfully, if need you should be restart deployment longhorn-driver-deployer for reinstalling driver on this node, but carefully
Once you’ve finished testing, you can press Ctrl+D to escape the terminal session in the Pod. Pod will continue running afterwards. You can keep try with command step 4 or delete.
kubectl delete pod xxxx
Note
Usually, curlimages/curl is regular used. Try to create new pod with fast as possible
# Normal commandkubectl run mycurlpod --image=curlimages/curl -i --tty -- sh# Delete pod when finish or exit with `--rm` optionkubectl run mycurlpod --image=curlimages/curl -i --tty --rm -- sh
wbitt/network-multitool - Include multiple tools, also tcpdump or tcptraceroute (Immediately Level)
nicolaka/netshoot - Wide range tools with superb like iptable, tshark, … (Complex Level)
For playground with those one, you just need only spin off one of this pod into Kubernetes Cluster with kubectl command
# If you want to spin up a throw away container for debuggingkubectl run tmp-shell --rm -i --tty --image your_req_image -- /bin/bash# If you want to spin up a container on the host's network namespace.kubectl run tmp-shell --rm -i --tty --overrides='{"spec": {"hostNetwork": true}}' --image your_req_image -- /bin/bash
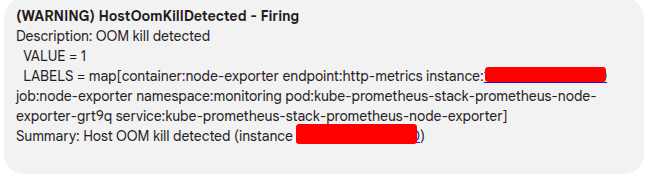
OOM Killed
Info
OOM (Out of Memory) is one of popular type of error in Kubernetes Cluster, but you know about how many does this error represent ? Let’s take a look below for find more techniques for investigate and resolve your problems
When you double-check, you OOM is not executing at Kubernetes Layer, it means your pod will not restart if meet limit (NOTE: this really’s strange, in my case our application run with multiple child process in parent, and it’s only killed child instead parent)
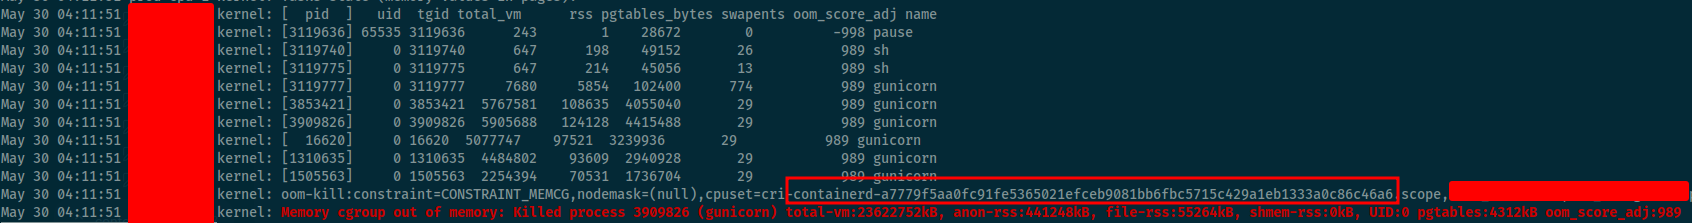
You can use journalctl to double-check this OOM killed
journalctl --utc -ke
This command allow you use journalctl to read information from kernel, and expose it into utc time. First of all, it’s really easier for debugging than using another tool like dmesg (same result)
Now you can see the error about OOM and figure out what happen with your application, if you use RKE2, you can double-check your killed process corresponds to what container
ctr -a /run/k3s/containerd/containerd.sock -n k8s.io containers ls | grep -e "<id-container>"
RKE2 Network DNS Debugging
Question
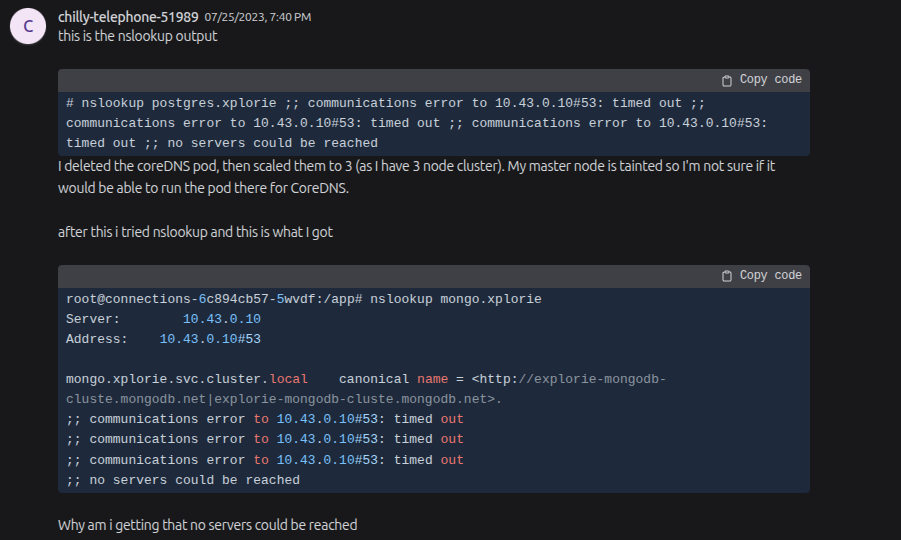
If you’ve already faced or are currently facing - Kubernetes DNS issues, you know they can create incredibly frustrating debugging moments that are far from easy. Consequently, I dedicated two days to learning and resolving the specific problem detailed below. This tutorial outlines precisely how I fixed it. Be sure to take note of this one!
In my experience, when attempting to self-host Kubernetes clusters, specifically on-premise solutions like K3s, RKE2, or other local Kubernetes setups, you’re likely to encounter a specific problem. Your pods might spin up, and components like CoreDNS, CNI, KubeProxy, and Kubelet appear to be functioning perfectly, yet your pods cannot communicate with services to resolve domains.
This issue then cascades, causing significant problems for health-checks, InitContainers, Jobs, Prehooking, and more, leaving you unsure where to even begin troubleshooting. Let’s list a couple of potential reasons, and I will separate into three levels, Rare, Unique and Special
(Rare) Your CoreDNS is in wrong configuration and CoreDNS can’t resolve your service domain with current configuration. These issues linked to
(Special) The Checksum TX is wrong configuration or not able fit with your kernel version in your network Interface, honestly to say if you encounter this problem, that ain’t gonna easy for understanding
(Unique) Firewall is turning on and there are some rules you settle up but make conflict with RKE2 or K3S, including firewalld, ufw or iptables. This one is not simple if you doesn’t understand what’s going on when turn on, turn off any rules in bunch of this 😄
That’s why you should make the checklist about DNS for your RKE2 or any selfhosted Kubernetes to prevent it
Always check out firewall because It’s really non sense with your RKE2 and K3s, let them do it for yourself
# Disable Uncomplicated Firewallufw disable
Check your iptables rules and, if possible, decline anything related to UDP/53 traffic. Specifically, if you find an iptables rule referencing IP 10.43.0.10 on Port 53, this could potentially be a risky configuration
# Check IP table rulessudo iptables -L -n -v --line-numbers# If you seen DROP with 53 and 10.43.0.10, e.g# Chain OUTPUT (policy ACCEPT 0 packets, 0 bytes)# num pkts bytes target prot opt in out source destination # 1 0 0 DROP udp -- * * 0.0.0.0/0 10.43.0.10 udp dpt:53 # 2 ...# You should delete this rule with ## Delete by Specificationsudo iptables -D OUTPUT -p udp --dport 53 -d 10.43.0.10 -j DROP## Delete by line numbersudo iptables -D <CHAIN_NAME> <LINE_NUMBER>
Warning
If you use or apply rule with higher firewall, like firewalld or ufw, you should handle the firewall deletion at there firewall instead iptables to prevent conflict
(Option - 1 ), If the firewall doesn’t a target, you should care about the configuration of CoreDNS which actually handle the resolve domain, both external and internal
# Edit the configmap of your CoreDNSkubectl edit cm -n kube-system rke2-coredns-rke2-coredns# Enhance the log and change default forward from# /etc/resolv.conf --> 8.8.8.8.:53 { log # Enable log errors health { lameduck 5s } ready kubernetes cluster.local cluster.local in-addr.arpa ip6.arpa { pods insecure fallthrough in-addr.arpa ip6.arpa ttl 30 } prometheus 0.0.0.0:9153 forward . 8.8.8.8 # Instead for /etc/resolv.conf cache 30 loop reload loadbalance}# Restart your CoreDNSkubectl rollout restart deployment -n kube-system rke2-coredns-rke2-coredns
(Option - 2), Re apply your RKE2 with new version kernel via APT. Read more at Update Ubuntu new version
(Option - 3) The Checksum TX is acutally problem, because I really ware this problem related to Ubuntu Server 20.04 with Calico or Flannel CNI, so it’s up to you for try and test but the temporary solution because when your machine reboot, it will restore to default configuration. In the best way, you can write the script and apply it as systemd in your system like Medium - Resolving Flannel-Related DNS and Metrics Server Issues in RKE2 Kubernetes on Ubuntu 22.04
Kubernetes Multi-Cluster Approach and Strategy Matrix
Clusters are rigid, highly governed boundaries (e.g., “The US-East Compliance Cluster”). Workloads must adapt to the cluster’s predefined configurations.
• Strict regulatory environments (HIPAA, GDPR).
• Large operations teams prioritizing absolute predictability.
• Fixed perimeter security requirements.
• Open Cluster Management (OCM)
• SUSE Rancher Prime
• Cluster API (CAPI)
• Red Hat Advanced Cluster Management
• Pro: High compliance and easy security audits.
• Con: Reduces developer flexibility; configurations tend to drift if not tightly controlled.
2. Application-Centric(Workload-First)
The workload dictates the infrastructure.
Clusters are viewed as interchangeable pools of compute. The developer defines application requirements, and a placement engine dynamically schedules it.
• High-velocity SaaS deployments across global environments.
• Teams running ephemeral or short-lived environments.
• Prioritizing abstracting K8s away from developers.
• Argo CD ApplicationSets (Cluster Generators)
• Karmada (Cloud-Native Federation)
• KubeVela / Plural
• OCM Placement API
• Pro: Complete developer autonomy and highly flexible scaling.
• Con: Requires complex traffic-routing policies and robust deployment automation.
3. Network-Centric(Connectivity-First)
The mesh unifies the fleet.
Individual cluster control planes are secondary. The focus is on building a flat, secure cross-cluster network overlay where services communicate seamlessly.
• Massive microservice architectures spread across clouds/regions.
• Low-latency cross-cluster service discovery is a hard requirement.
• High Availability with active-active traffic routing.
• Cilium ClusterMesh (eBPF-powered)
• Istio Multi-Cluster (Primary-Remote)
• Linkerd Multi-Cluster
• Traefik Hub / Geo-routing
• Pro: Elegant service-to-service discovery across boundaries without public entry points.
• Con: High networking cognitive load; failure troubleshooting requires deep eBPF/BGP expertise.
4. Data-Centric(State & Gravity-First)
Compute follows the storage layer.
Architecture is designed around data gravity (the concept that data is heavy and expensive to move). Clusters are deployed strictly where data residency or low-latency stateful access dictates.
• Edge computing / IoT deployments processing local data.
• Massive data analytics or AI/ML training jobs targeting localized datastores.
• Pro: Bulletproof data compliance, high local read/write performance.
• Con: State synchronization across clusters introduces massive latency or synchronization conflicts.
5. Split-by-Service(Functional-First)
Heterogeneous clusters for specialized roles.
Clusters are deliberately separated by their functional requirements or underlying hardware dependencies instead of environments.
• Teams blending standard web applications with heavy GPU workloads (AI/ML).
• Separating untrusted third-party code from internal operations.
• Optimizing cloud spend via targeted compute node pools.
• Karpenter (Just-in-time node provisioning)
• HAMi (GPU sharing/scheduling operators)
• Ray on Kubernetes (KubeRay)
• Volcano (Batch scheduling)
• Pro: High cost efficiency and optimal resource utilization.
• Con: Cross-service communication becomes complex, requiring strict API gateways or inter-cluster meshes.
Multi-Cluster “Aproach” Strategies
Here is the evolutionary matrix of multi-cluster strategies, moving from the earliest approaches to modern production-grade standards.
Generation / Strategy
The Core Concept & Visual Metaphor
Evolution Period
Key Open-Source Tools
Pros
Cons
1. The Island Model(Siloed / Independent)
“Every Cluster is an Isolated Kingdom”
Each cluster is built, upgraded, and managed completely independently. Engineers manually switch contexts to deploy apps.
2015 – 2018 (Early K8s Days)
• kubectl (context switching)
• Bash / Python automation scripts
• Ansible / Terraform
• Total isolation; a failure in one cluster cannot affect another.
• Simplest conceptual model to understand.
• Severe configuration drift across environments.
• Massive operational fatigue as the number of clusters grows.
• No native cross-cluster communication.
2. Kubernetes Federation(KubeFed v1 / v2)
“The Single Emperor Control Plane”
An umbrella “Federation Control Plane” sits above all clusters. You submit a single configuration to the master API, and it attempts to duplicate or split resources across downstream clusters.
2017 – 2021 (The Experimental Era)
• KubeFed(v1 & v2 - now archived/deprecated)
• Early prototype frameworks
• Single API endpoint to manage workloads globally.
• Native cross-cluster replica scheduling.
• Extremely high architectural complexity.
• Custom Resource Definitions (CRDs) broke easily across federated boundaries.
• If the federation master crashed, downstream cluster sync froze.
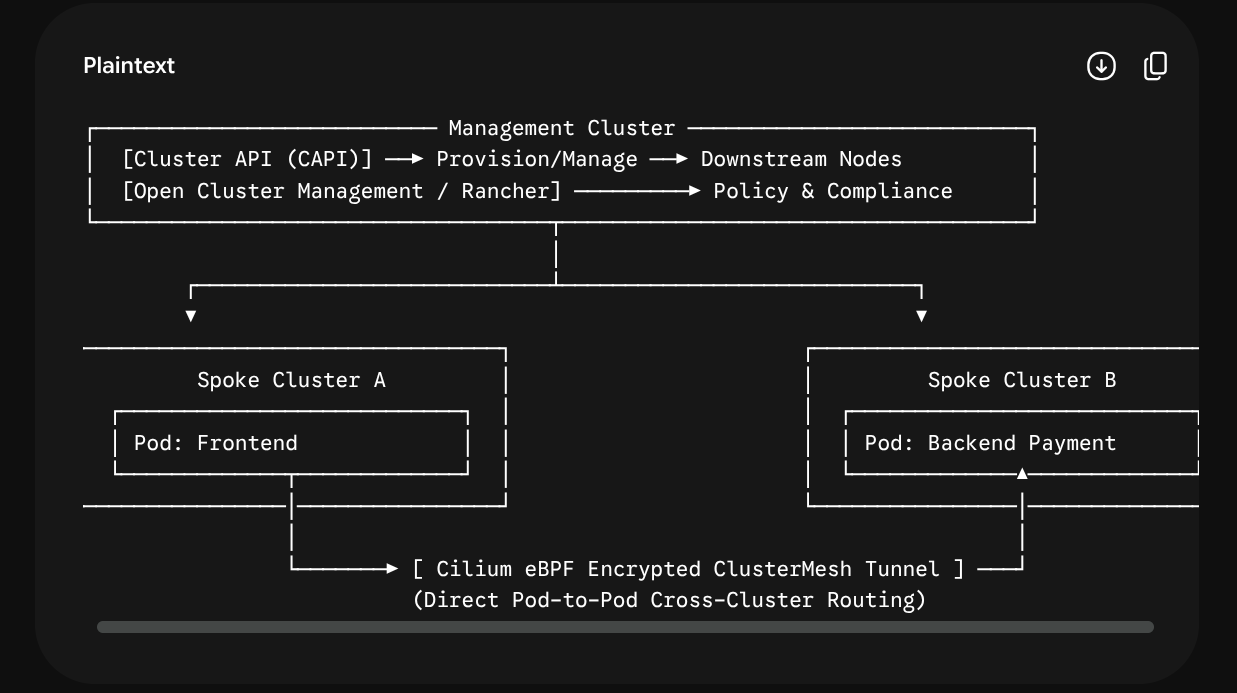
3. GitOps Hub-and-Spoke(Modern Standard)
“Git is the Source of Truth; The Hub is the Operator”
Instead of unifying the Kubernetes APIs, this approach unifies the State via Git. A central management cluster (Hub) reads Git manifests and uses push/pull mechanics to deploy to target downstream clusters (Spokes).
Combines declarative cluster lifecycle management (treating clusters as programmatic objects) with high-performance eBPF networking to create a flat cross-cluster network overlay.
2022 – Present (The Platform Engineering Era)
• Cluster API (CAPI)(Lifecycle)
• Cilium ClusterMesh(Networking)
• Rancher / Open Cluster Management (OCM)(Fleet Management)
• Karmada(Modern Cloud-Native Federation)
• True multi-cluster service discovery (Pods in Cluster A can talk directly to Pods in Cluster B securely via eBPF).
• Dynamic, programmatic scale-out of infrastructure.
• High Availability & localized failover.
• Requires deep networking expertise (eBPF, BGP, routing).
• High initial design and setup overhead.
• Significant cognitive load to maintain day-2 operations.
1. The Island Model (Manual)
Imagine you have three servers in three different regions. To deploy an update, your script must sequentially connect to Server 1, execute a command, switch tokens, connect to Server 2, execute a command, and so on. If Server 2 fails halfway through, your environment is left in a broken, half-updated state.
2. The Federation Model (Centralized API)
Imagine a giant proxy. You tell the proxy: “I want 10 replicas of my application spread across the world.” The proxy handles the math, talking to the individual clusters for you. However, if one cluster runs a slightly different Kubernetes version or lacks a specific storage class, the proxy configuration breaks, blocking the entire system.
3. GitOps Hub-and-Spoke (State Synchronization)
Think of this like a television broadcast network. You don’t configure individual TVs. Instead, you update the video file at the central studio (your Git repository).
The Argo CD Hub reads the repository and uses an ApplicationSet.
It looks at a list of cluster targets and broadcasts the specific configuration overlay to Cluster-Dev, Cluster-Staging, and Cluster-Prod simultaneously.
If a cluster loses connection to the hub, it safely continues broadcasting its last known state until connection is restored.
In this model, the boundaries between clusters become transparent to the software layer.
You use Cluster API (CAPI) to define your clusters in code. If you need a new environment, you commit a manifest, and a new downstream cluster automatically spins up (e.g., an RKE2 or K3s cluster on bare-metal or cloud infrastructure).
Simultaneously, Cilium ClusterMesh connects their control planes at the network layer. If a service running in your Staging cluster needs to query a global shared database service in a management cluster, it can call database.shared.svc.cluster.local natively. Cilium routes that traffic safely across cluster borders using encrypted eBPF tunnels without needing public ingresses or complex reverse proxies.
Multi-Cluster “Team Size” Matrix
Note
Designing a Kubernetes architecture that seamlessly combines multi-cluster, multi-tenant, and multi-environment (Dev/Staging/Prod) strategies is the ultimate goal of modern Platform Engineering. The primary challenge is balancing two opposing forces: Isolation (Security & Blast Radius) vs. Velocity (Operational Overhead & Cost).
• Excellent environment parity (Staging matches Prod). • Reduced blast radius. • Developers get high autonomy in Dev.
• Minimum blast radius. • High Availability (HA) & Disaster Recovery (DR) ready. • Scalable to hundreds of engineers.
Cons
• Risk of Noisy Neighbors in Dev/Staging.
• High blast radius if Non-Prod fails.
• Shared credentials in Argo CD.
• Increased cloud bill.
• Requires strict configuration management to prevent environment drift.
• Extremely high operational complexity.
• Requires a dedicated, mature Platform Engineering team.
Multi-Cluster “IDP Research and Implementation” Matrix
Architectural Centric
IDP Control Plane & Orchestration Role
Research & Implementation Range (Your R&D Focus)
Core Open-Source Stack (The Glue)
Developer Experience (DX) Outcome (What Devs See in the Portal)
1. Cluster-Centric(Infrastructure-First)
Acts as a Cluster-as-a-Service (CaaS) engine. The IDP treats Kubernetes clusters as dynamic, disposable resources.
• Declarative cluster provisioning blueprints.
• Fleet-wide policy compliance.
• Automated multi-cluster upgrades and configuration syncing.
• Cluster API (CAPI)
• Open Cluster Management (OCM)
• Crossplane (K8s provider)
• SUSE Rancher
A button in the Developer Portal that says: “Provision new isolated Staging cluster for Team X.” All networking and baseline configurations are fully automated.
2. Application-Centric(Workload-First)
Acts as an Application Delivery Fabric. The IDP completely hides the concept of clusters from the developer.
• Custom Software Templates (Golden Paths).
• Advanced GitOps abstraction (ApplicationSets).
• Multi-cluster workload placement algorithms.
• Backstage (Software Templates)
• Argo CD (ApplicationSet generators)
• KubeVela / Plural
A single catalog item: “Create new Go Microservice.” The platform automatically provisions the Git repo, binds it to Argo CD, and decides which cluster it should run on.
3. Network-Centric(Connectivity-First)
Acts as a Global Service Router. The IDP manages cross-cluster connectivity, global load balancing, and secure ingress automatically.
• Cross-cluster service discovery.
• eBPF-based multi-cluster network meshes.
• Dynamic, automated Ingress/Egress generation.
• Cilium (ClusterMesh)
• Traefik / Traefik Hub
• Istio (Multi-Primary)
The developer exposes a service via a simple manifest or form, and the IDP automatically registers it to a global DNS name like api.internal.company.com across multiple regions.
4. Data-Centric(State & Gravity-First)
Acts as a Data Lifecycle Fabric. The IDP handles localized data storage, database synchronization, and caching topologies.
Developers request a database inside their application configuration, and the platform safely provisions local cloud instances or highly available distributed databases without exposing any sensitive keys.
5. Split-by-Service(Functional / MLOps Centric)
Acts as an Intelligent Workload Router. The IDP identifies application requirements and places them on specialized compute clusters.
• Advanced batch scheduling algorithms.
• Virtualization of scarce physical resources (vGPUs).
• Just-in-time reactive autoscaling based on compute demand.
• Karpenter (Node scaling)
• HAMi (Heterogeneous Advanced vGPU Manager)
• KubeRay / Volcano
A machine learning engineer chooses an AI template, and the platform automatically places their Jupyter Notebook onto a dedicated GPU cluster utilizing optimized vGPU slicing.
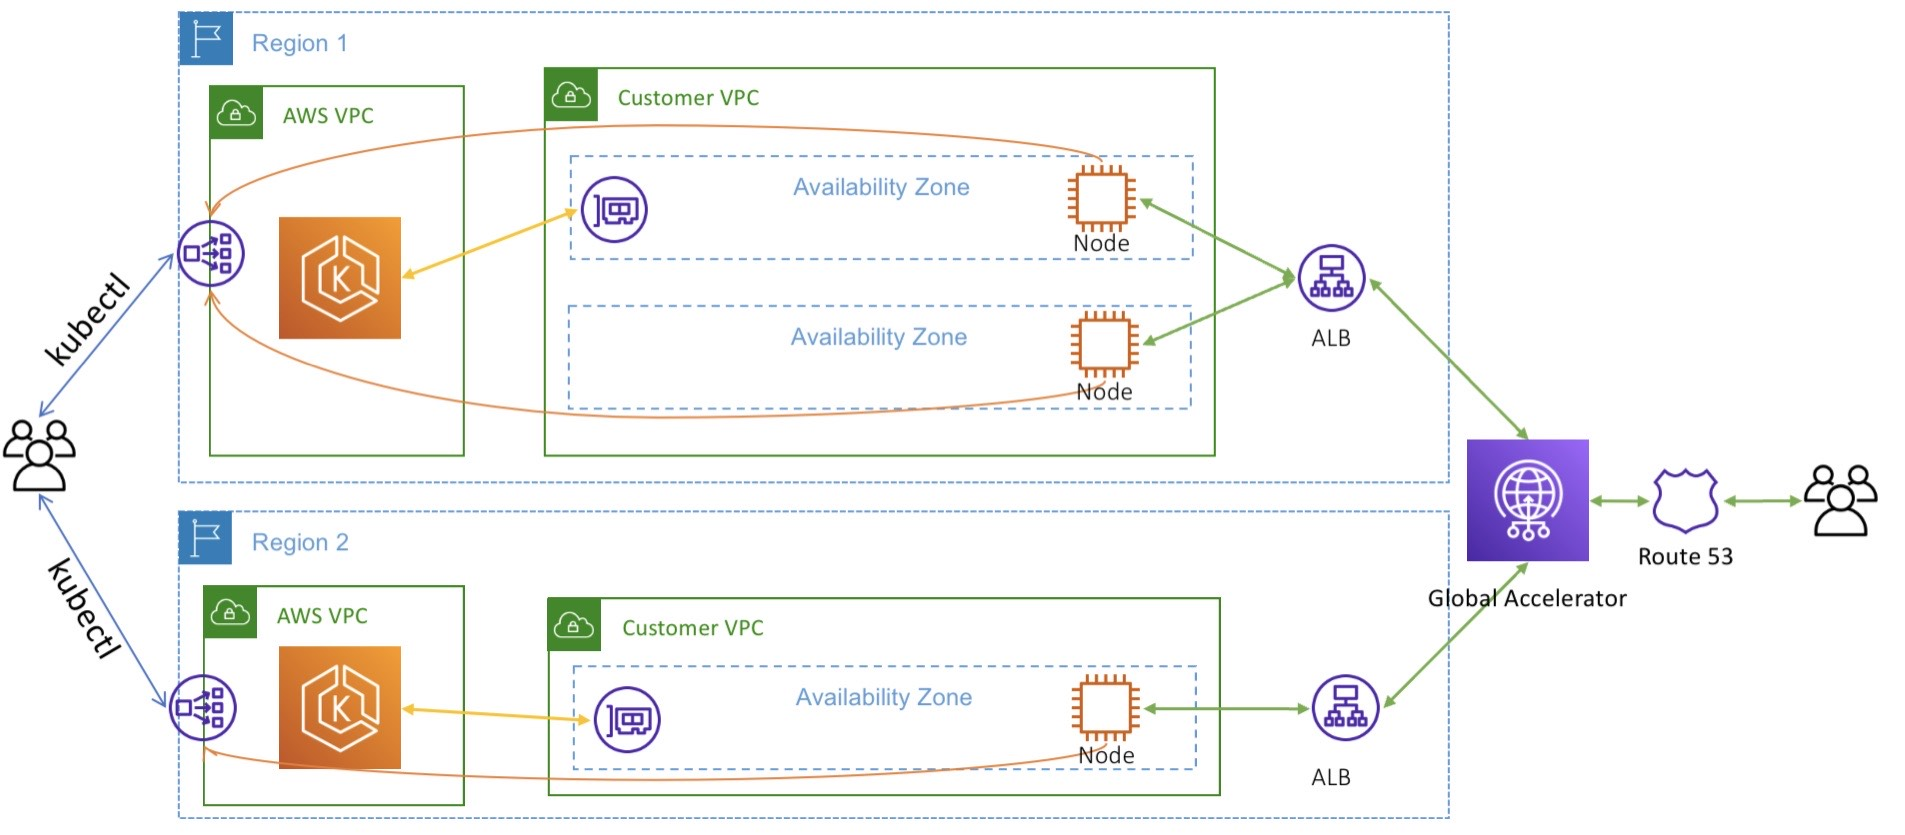
Multi-Cluster “Global Traffic Routing” Matrix
When controlling global traffic ingress across regions, the architectural decision usually splits down two pathways: relying heavily on Cloud Providers’ Global Networks or choosing a Kubernetes-Native Open Source (OSS) Fabric.
Architectural Dimension
Cloud-Managed Global Routing Layer
Open-Source / Kubernetes-Native Fabric
Core Mechanism
Anycast IP Layer & Managed Edge Routing
Traffic hits the nearest cloud Point of Presence (PoP) via a unified Global Anycast IP and is routed through the cloud’s private fiber backbone directly to your regional cluster backends.
Smart DNS Synthesis & Control-Plane Mesh
Traffic routing relies on a decentralized, native K8s DNS setup or flat network interconnects where clusters act as equal peers to resolve and pass traffic.
Primary Tooling Stack
• GCP Multi-Cluster Ingress (via Global Application LBs & NEGs)
• AWS Route 53 (Latency/Geo-routing) + ALBs
• Azure Traffic Manager / Front Door
• k8gb (Kubernetes Global Balancer via CoreDNS operator)
• Cilium ClusterMesh (with Global Services annotations)
• Traefik Hub (Geo-routing engine)
How Health Probing Works
Cloud-native edge proxies frequently ping regional load balancer endpoints or target groups from multiple global regions.
The K8s operator inside the cluster converts standard application Liveness and Readiness probes directly into live DNS routing records.
Single Point of Failure (SPOF)
Low Infrastructure Risk, High Vendor Lock-in.
If the cloud provider’s global IAM or control plane experiences a massive outage, global routing changes can freeze.
Zero Global SPOF.
Each region runs its own DNS/Mesh control plane. If Region A goes dark, Region B’s local instances continue running perfectly.
Cross-Region Inter-Pod Traffic
Traffic must exit Cluster A via Ingress, traverse the cloud load balancer, and re-enter Cluster B through its public entry points.
Direct Overlays. Pods in Region A speak natively to Pods in Region B over encrypted wireguard/VXLAN tunnels using eBPF (Cilium ClusterMesh).
Pros
• Blazing fast edge execution with minimal client-side latency.
• Native, high-scale DDoS protection at the cloud boundary.
• Extremely low maintenance for the Platform Team.
• Total multi-cloud portability (runs identically on AWS, bare-metal, or hybrid clusters).
• Highly cost-effective; skips expensive cloud GLB data processing fees.
• High cloud data processing and cross-zone egress costs.
• Hard constraint: Requires you to stay within that specific cloud provider’s ecosystem.
• Higher initial setup complexity for the Platform Team.
• DNS TTL propagation delays can sometimes lead to transient traffic drops during sudden failures.
To successfully link this into your platform’s core code, your team needs to focus its research on two core choices:
1. Anycast Layer-7 Routing vs. Geo-DNS
If you choose Cloud GLB (Layer-7 Anycast): External users query a single IP address worldwide. The cloud network automatically steers packets to the optimal region at the fiber layer. This is excellent for high-performance internet applications, but it requires deep integration with specific cloud objects (like Google’s Network Endpoint Groups).
If you choose Open-Source (k8gb): Each cluster runs a lightweight CoreDNS instance acting as a top-level authority for your application’s domain. When a client requests app.company.com, the clusters dynamically negotiate who is healthiest and return the exact regional IP. It mimics expensive hardware GSLBs using pure cloud-native open source.
2. The Ingress Boundary vs. The Flat Network Mesh
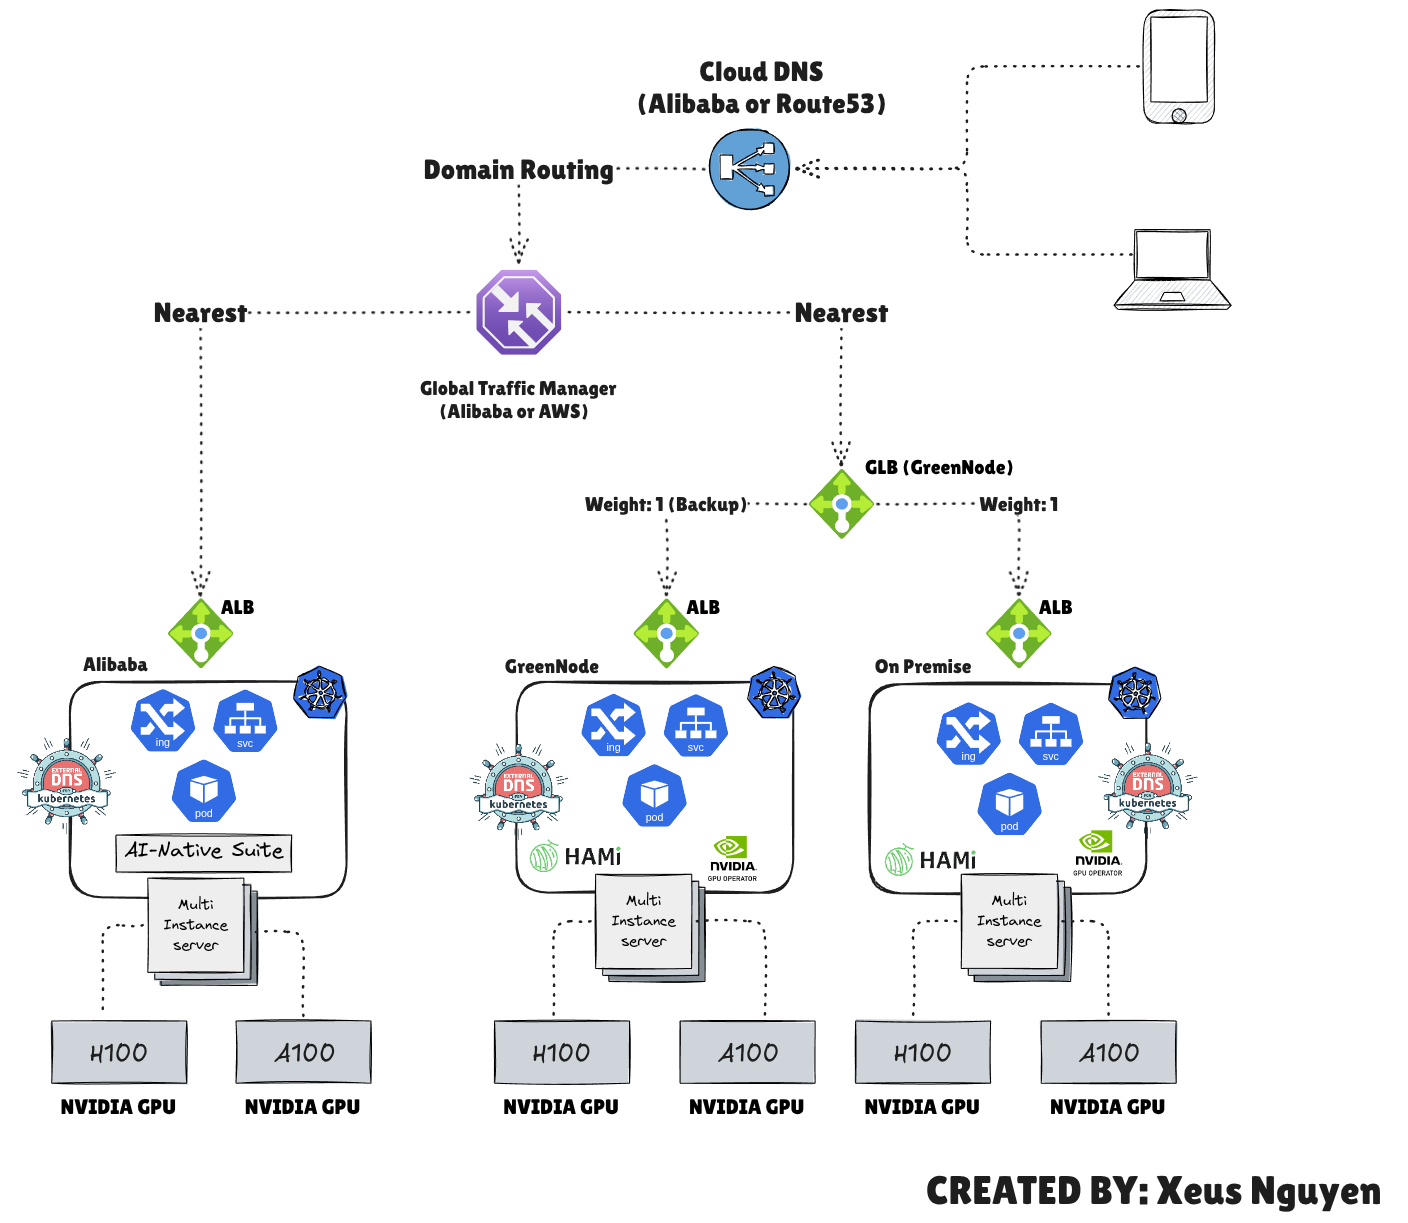
The true power move for an internal developer platform comes from combining Edge Ingress with an Internal Mesh:
The Connected Multi-Region Pattern:
Use Cloud DNS / CDN at the absolute edge to guide the initial user traffic to the closest healthy regional cluster gateway (e.g., your regional Traefik Ingress instances).
Inside the clusters, implement Cilium ClusterMesh. If an application backend in Europe needs to fetch a payload from a shared master service in the US, you annotate the service file:
An admission controller is a piece of code that intercepts requests to the Kubernetes API server prior to persistence of the resource, but after the request is authenticated and authorized.
Several important features of Kubernetes require an admission controller to be enabled in order to properly support the feature. As a result, a Kubernetes API server that is not properly configured with the right set of admission controllers is an incomplete server that will not support all the features you expect.