Quote
Hi @all, It’s me again, so what for doing today ? I want to talk about new ways to monitoring application but deepest into
memorycpuprocessand more about the resources used by them when we interact withWeb-ApporAPI. Let’s me explain that
What is meaning of Profiling ? Explain more
History and brief about profiling application
As you know, we have some technologies when we applied monitoring to your application like metrics logs tracing. These technologies will have role for special purpose but when you meet hard case like memory leaking or anomaly increasing resources, these one can’t be handle. Therefore, next generations technology releases to resolving problems - profiling
May be you can explain more about profiling or continuous profiling via documentations like
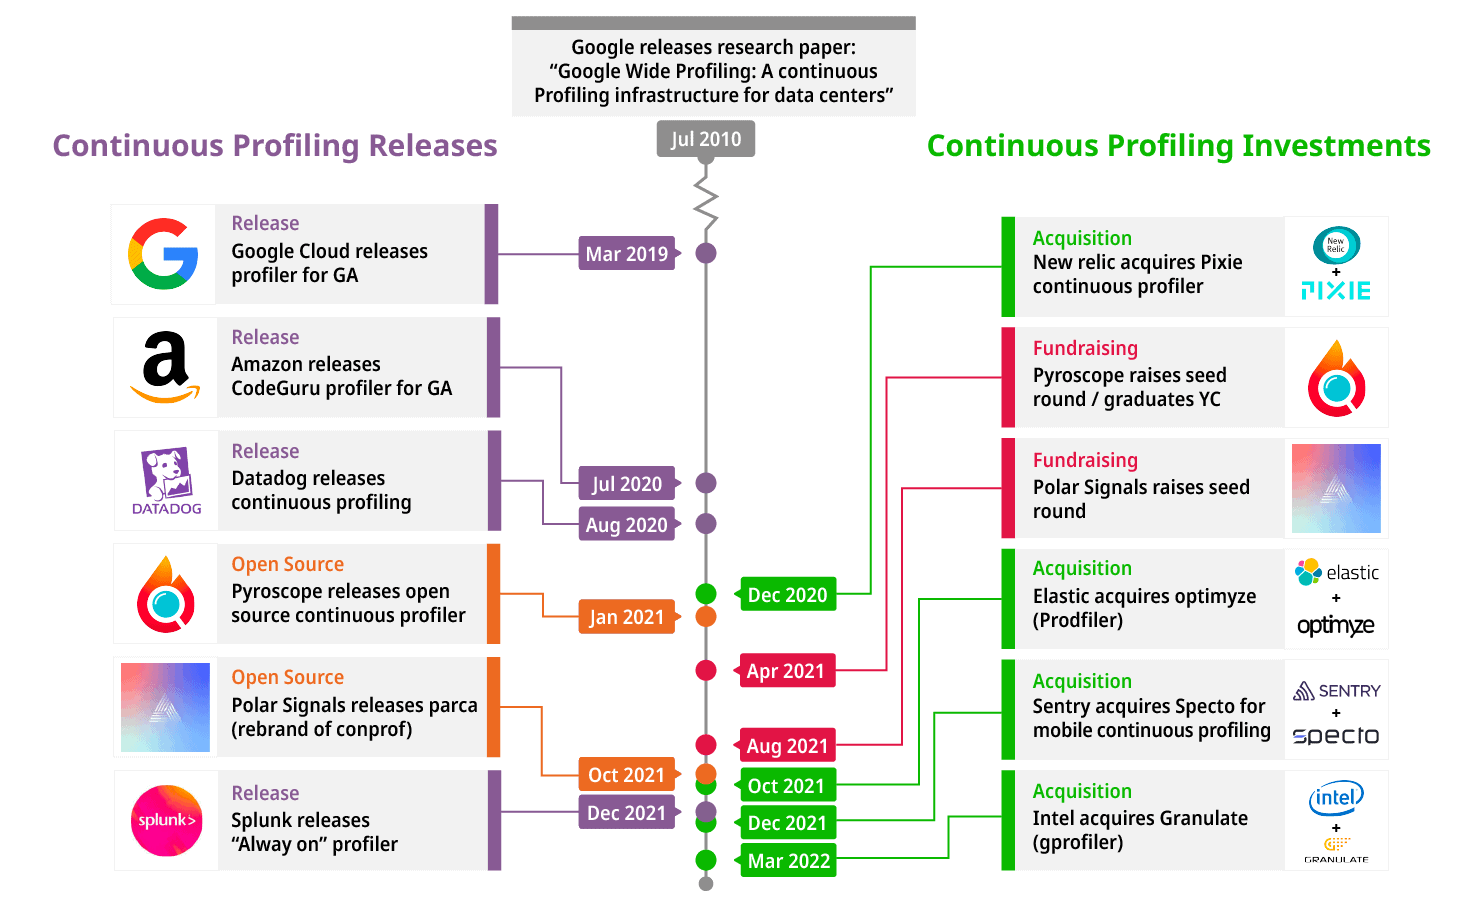
History of Profiling Applications
So when you take the look to timeline map, you will have see continious profiling is not new technologies, It was came from 13 years ago. And last 4 years, This technologies is growth up, received and studied by many large organizations.
Fact
Chris Aniszczyk, CTO of the Cloud Native Computing Foundation (CNCF) agrees that continuous profiling is an integral part of the observability stack.
Although, We have three of powerful technologies which purpose continuous monitoring and currently we are having four (eBPF - Expanded version of profiling), plus on profiling. Today, when we setup the monitoring cluster, profiling is becoming important parts then support for us to deepest research the performance, increase the experience or maybe know what workflow application exec on work progressed
Candidate of Profiling Application and Pyroscope
Candidate and powerful tools for profiling application
In the github or many article, I have look some more interesting and It will helpful when you research with profiling application, like:
- Sysinternals Process Utilities - ProdDump is impressed talent (Support for both Linux and Windows)
- Flame Graphs- The template dashboard which can most refer to view result when do profiling application
- perf-script- Read
perf.data(created by perf record) and display trace output - kubectl flame - Profiling on Kubernetes
- Apache SkyWallking - Activating Automatical Performance Analysis — Continuous Profiling
- Pyroscope or Grafana Flare- Why use Grafana Pyroscope for continuous profiling?
- eBPF - Dynamically program the kernel for efficient networking, observability, tracing, and security
- pprof - Google - Tool for visualization and analysis of profiling data.
- Continuous Profiling: A New Observability Signal
Quote
At Pyroscope, we actually profile our own servers using Pyroscope and have found many cases where profiling has saved us a lot of time and money by identifying performance issues. That being said, at any organization, understanding resource utilization and adjusting to allocate it efficiently can be the difference between a healthy company with happy end-users (and employees) or a chaotic one where everyone is running around putting out fires and end-users are suffering.
There is no better tool than continuous profiling to help be the difference-maker in these situations. No matter what your job function is in your organization there are still very valuable benefits of having continuous profiling as part of your observability stack. Uchechukwu Obasi - What is continuous profiling? - Posted in cncf.io
Grafana Pyroscope and feature
Maybe, we have more candidate to promote, but I have experience work on Pyroscope - Opensource continuous profiling with high performance. Let try so what It got
![]()
First of all, You need to checkout some links down-below to understand Pyroscope and strategy when we use those technology
Info
What is Grafana Pyroscope?
Grafana Pyroscope is an open source continuous profiling database that provides fast, scalable, highly available, and efficient storage and querying. This helps you get a better understanding of resource usage in your applications down to the line number. (From grafana.com)
Grafana Pyroscope allows you to aggregate continuous profiling data with high availability, multi-tenancy, and durable storage. Pyroscope also provides you with multi-language support, ad-hoc profiling, profile sharing, and more!
How do make Pyroscope to become unique and different ? (Powerful !!! 🙌🙌🙌🙌)
- Easy to install with just one binary and no additional dependencies
- Provides durable, long-term storage of your profiling data to help you identify changes and trends over time
- Horizontally scalable, distributed architecture means that Pyroscope can easily be scaled out to handle more incoming profiles
- Fully compatible with Grafana so you can correlate profiling data with your existing metrics, logs, and traces
- Consistent architecture with Loki, Mimir, and Tempo, which reduces the learning curve and cognitive load for those operating Pyroscope alongside Grafana Labs’ other databases
- Can be run in a highly available configuration to ensure 100% uptime, even during upgrades and machine failure
- Multi-tenancy and isolation make it possible to run one database for multiple independent teams or business units
- Because Pyroscope uses object storage, you can store all the history you need without breaking the bank. AWS S3, Google Cloud Storage, Azure blob storage, OpenStack Swift, and any S3-compatible object storage supported
How is It actually work ?

Step work on by Pyroscope
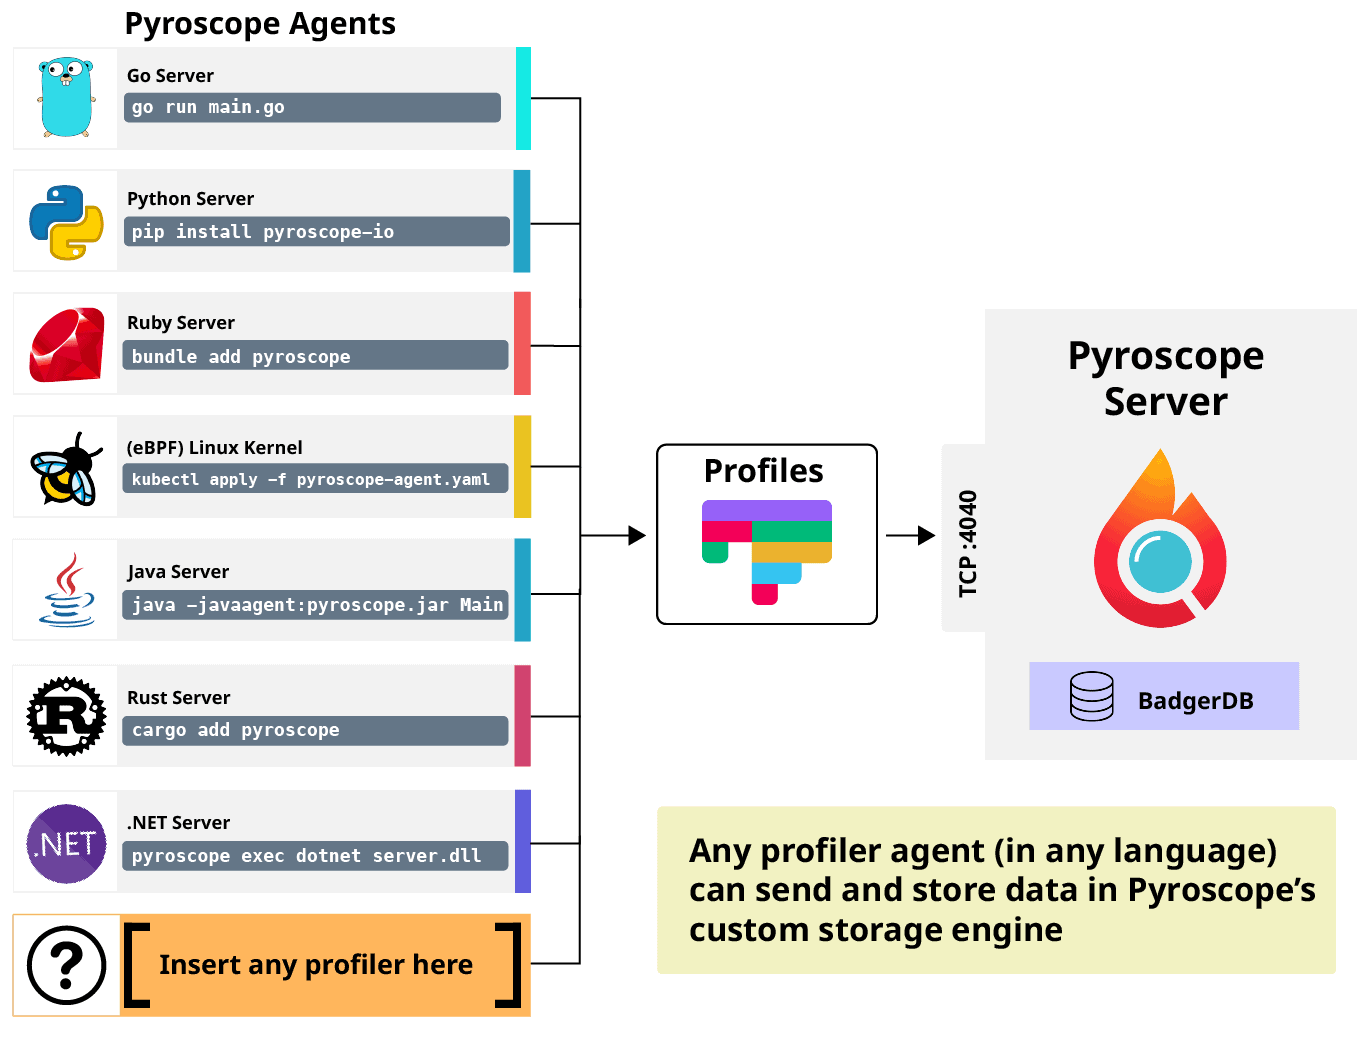
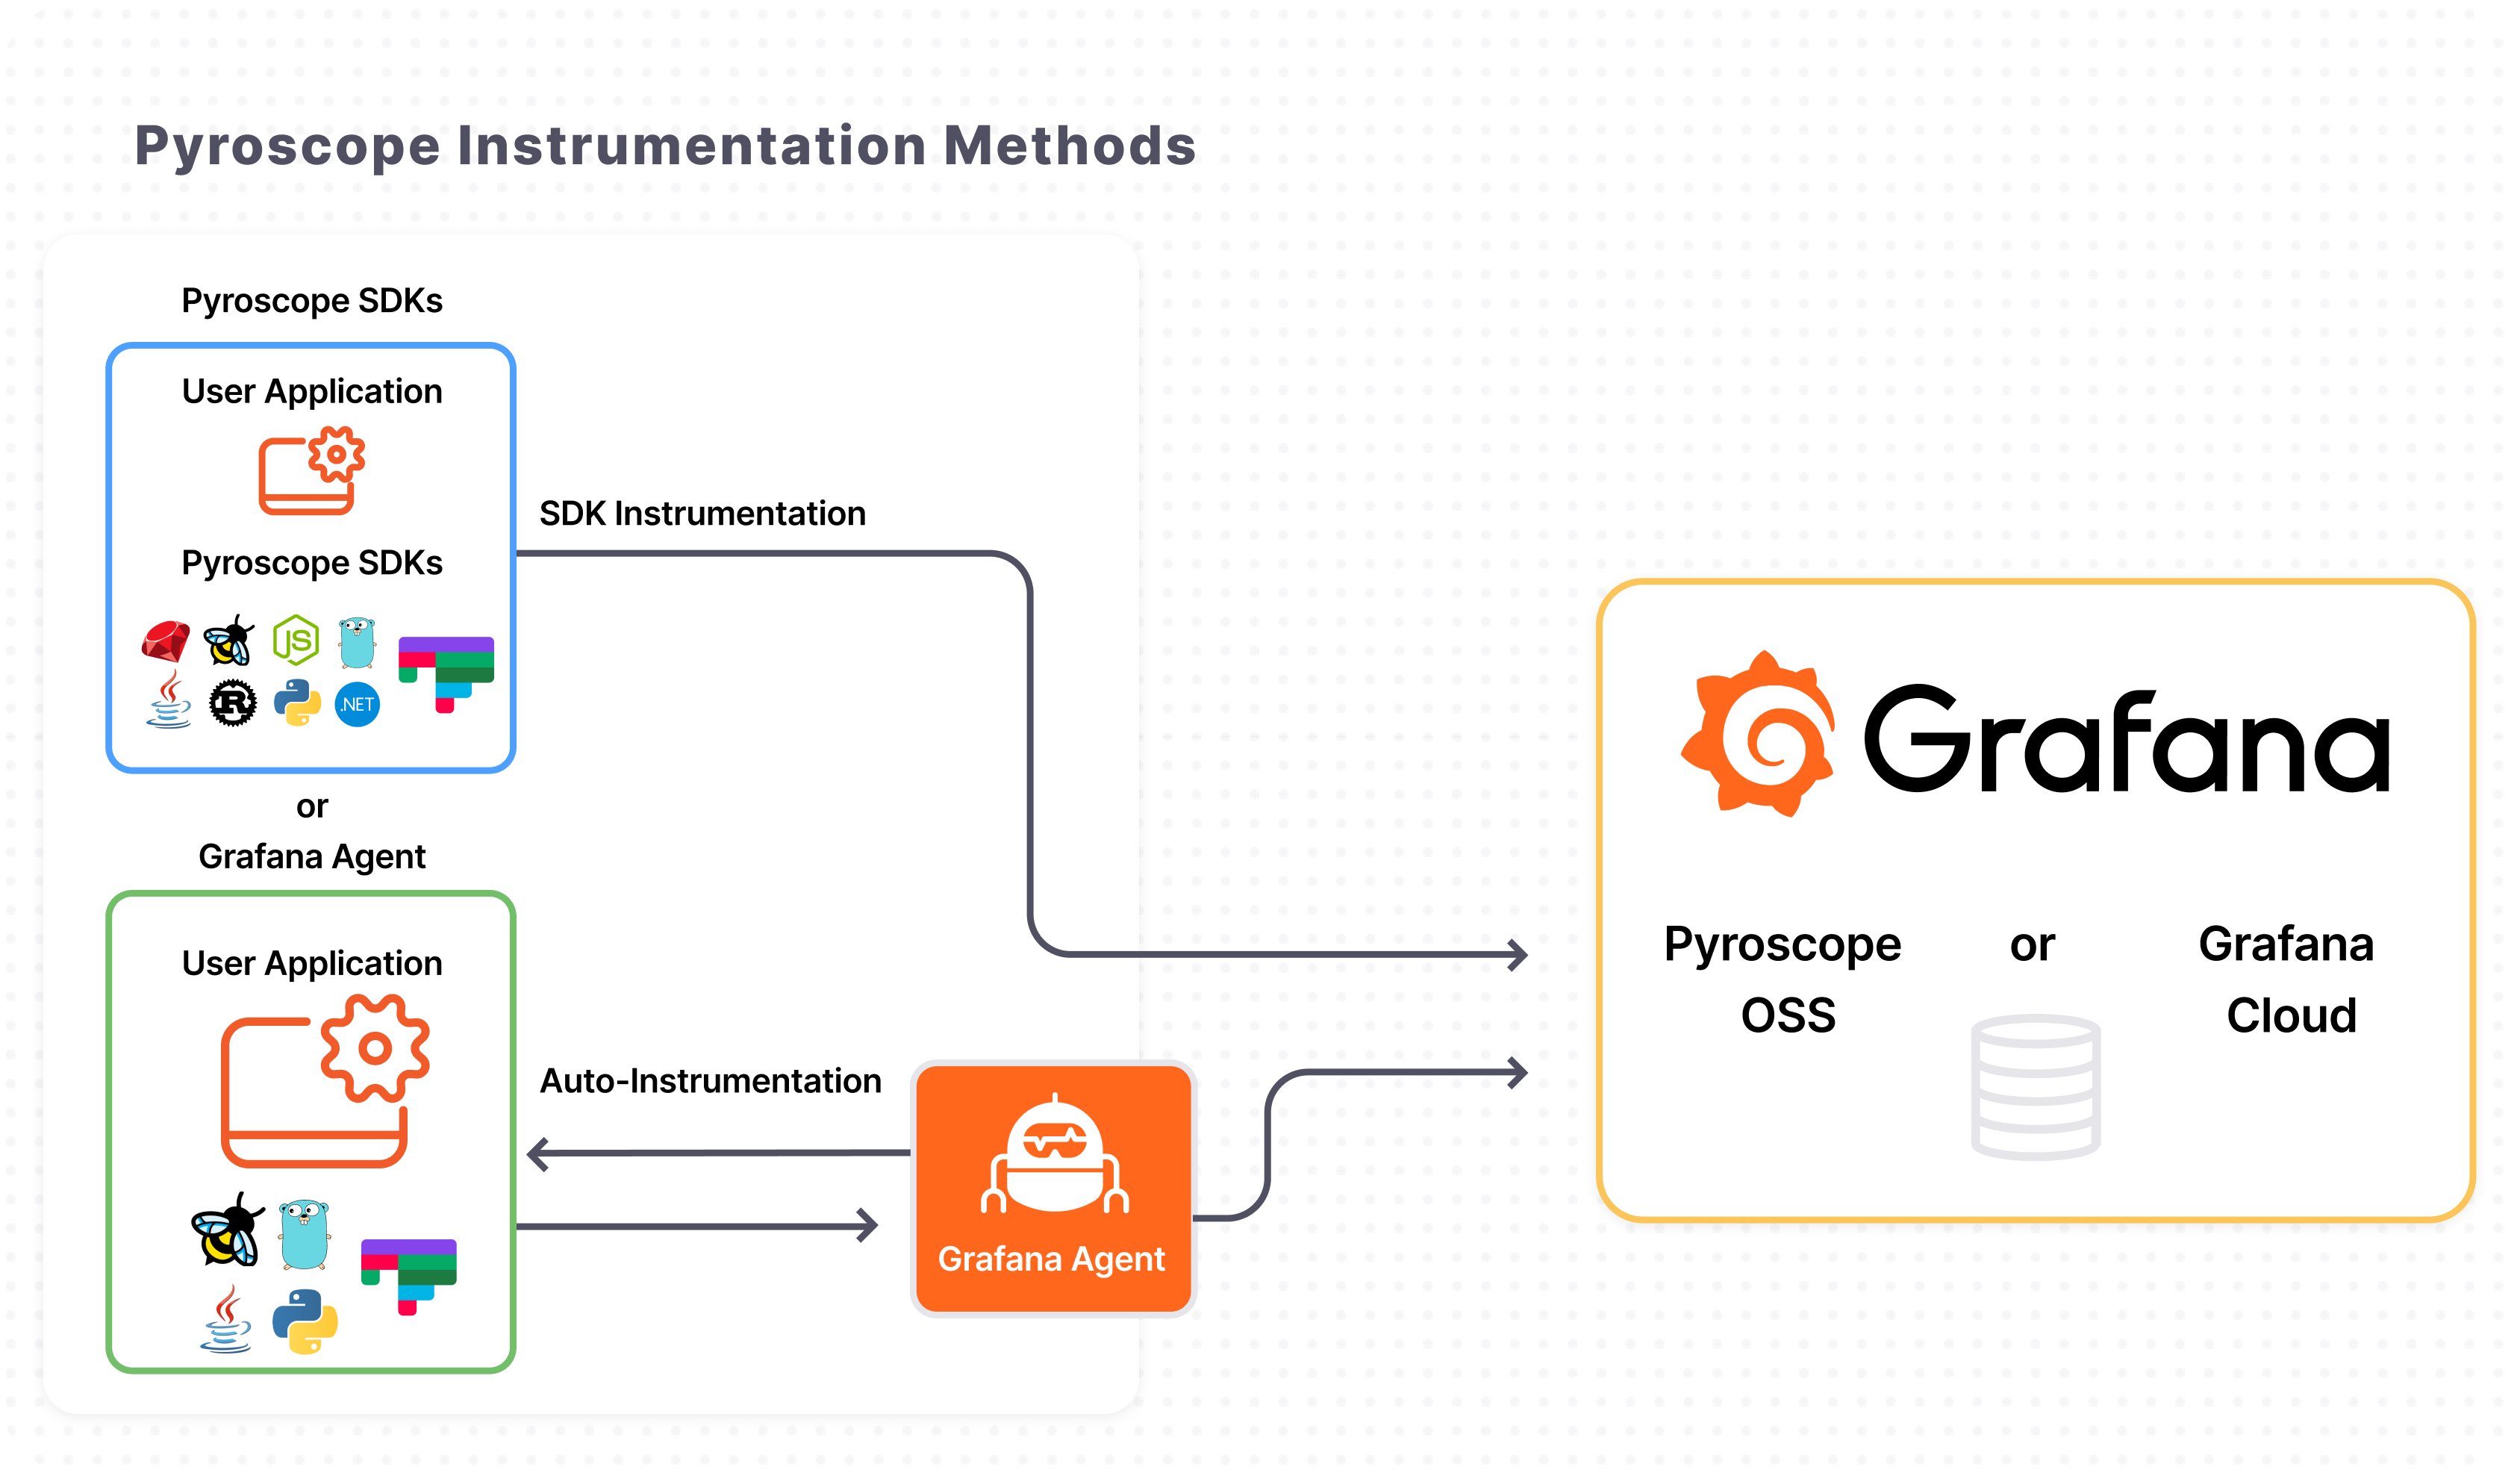
SDK or Pyroscope Agent
How can we setup Pyroscope and continuous profiling
Setup Pyroscope Server
With Pyroscope Server, you have multiple way to deploy that stuff via
- Kubernetes - Used Helm, Jsonnet and Tanka
- Docker - Image on Dockerhub
- Binary Stuff - Release 1.4.0
Easily, you just need docker or podman to install and exposing Pyroscope server. On my situation, I have docker on my system and pull image, exposing port 4040. Play with Pyroscope
docker run -d --name pyroscope -p 4040:4040 grafana/pyroscope
And done, try to access the server with browser in location http://localhost:4040 and here is it, WebUI of pyroscope 🙌🙌🙌

If you want want to more explore the configuration with Pyroscope, you will need to config parameter for changing to expected profile in /etc/pyroscope/config.yaml or view config status on route api/v1/status/config ▶️ ▶️ Configure the Pyroscope server
Intergration with Grafana
![]()
Info
IDK why but when I tried Grafana version
9.1.4, It’s not enabled and work at all withpyroscopedatasource. So you try more and find out the suitable version Grafana to supporting pyroscope. In my case, I recommend you to using Grafana version> 10.xto receiving the supporting.
With Grafana, This is visualizer, observation and monitoring tools. It’s just only like that, Grafana use the datasource from multiple resource to collected and visual on itself via dashboards. Grafana support for many tools, 3th party, service, cloud and more ever dashboards pluggin. You can learn and find way to configuration Grafana in Install Grafana.
Currently, you have multiple way to setup Grafana, It can be
- Docker - Image on Dockerhub
- Kubernetes - Use Helm, YAML self-provision
- Binary Stuff - Download Grafana
- Grafana Cloud - Use Grafana in Grafana-Cloud
On my situation, Docker is the best choice, Just a one command and you will get the Grafana in your host
docker run -d --name grafana -p 3000:3000 grafana/grafana:latest
Again, you need to try access localhost:3000 to reach WebUI of Grafana. Here is it, default username and password is admin:admin
When you want to add datasource, you need to login with admin user for having full privilege to handling this. Go to this step and you will integrate the Pyroscope server to Grafana
- Go to
homesymbol in left edge, find theConnectionsand expand that with arrow. Choose click inData sources - If you go to the Data sources tab, Click on the add datasource and find the Pyroscope
- It will redirect you into additional tab,
grafana-pyroscope-datasource. Next, you can config your datasource withname, url, cookie, auth(NOTICE:urlis your DNS of Docker or maybe your localhost - configuration networking, consideration when use - default:http://<pyroscope-ip>:4040)
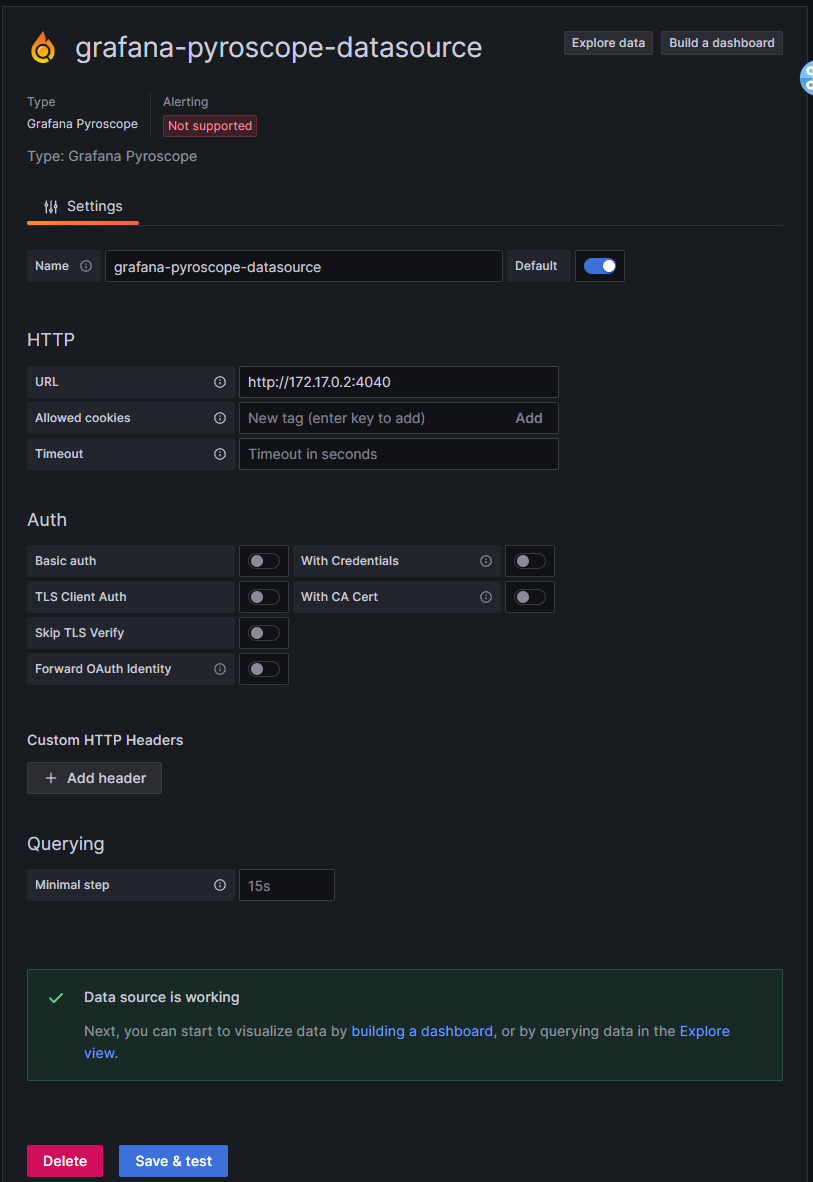
- Back to the
Hometab, findexploreand selectpyroscope. Choose the optional in some field, click query button or blue button on edge of right
Continious profiling application with Pyroscope
As you know, Pyroscope is produced for monitoring stack trace of programing with multiple language support. You can use SDK or Grafana Agent to directly collect information with continuous from app and deliver to server with least delay. Find more information from Configure the client to send profiles
In this blog, I will focus on using SKD to understand code block and environment variables which need config for app send profile to server. Currently, SDK of Pyroscope support for
I will reach to example of Python and figure out what we need to do when try Pyroscope with Python. Thanks for detailing the example from Pyroscope ▶️ ▶️ ▶️ Example Python
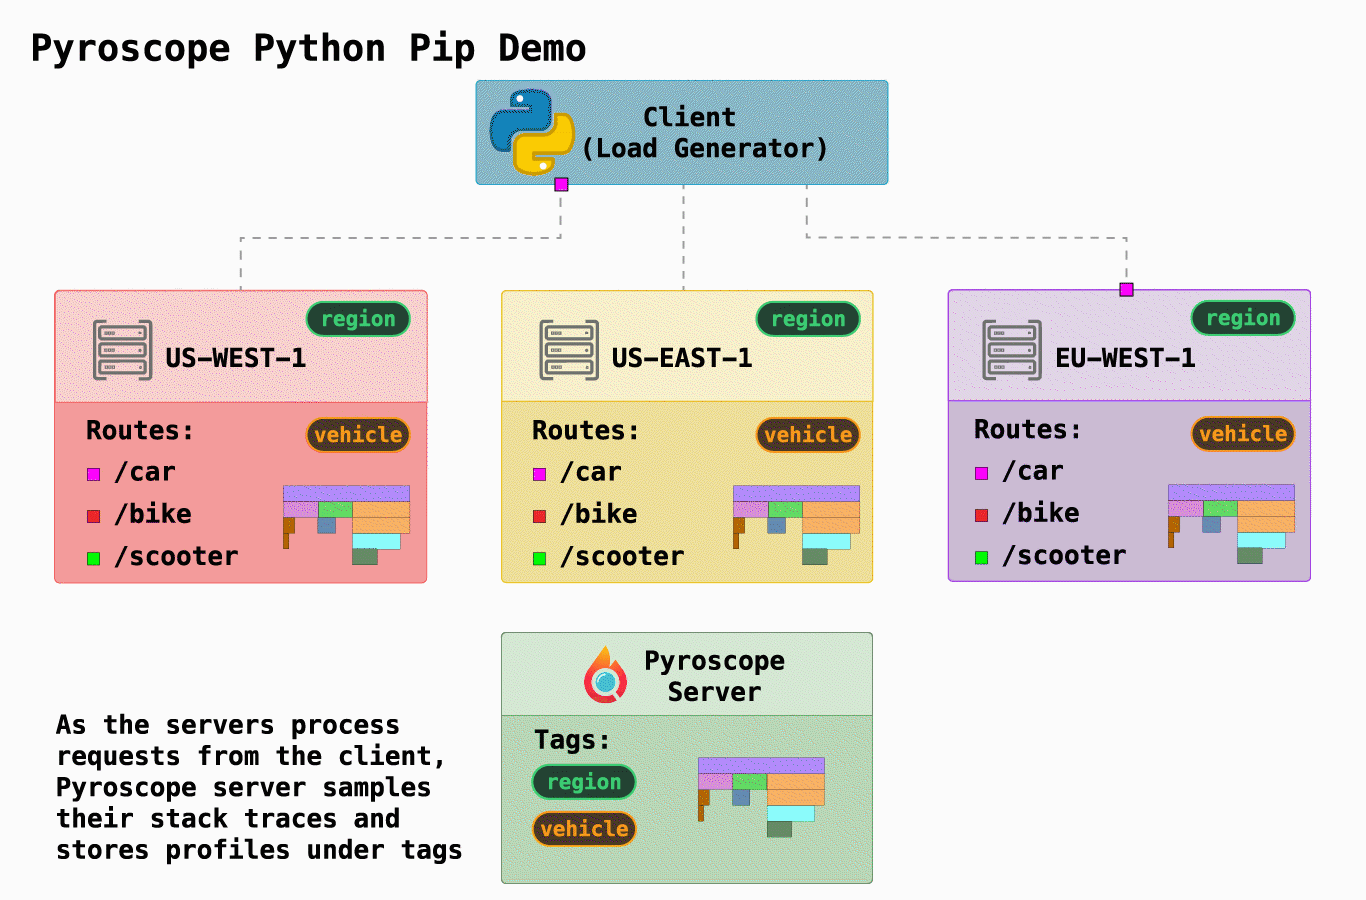
Profiling a Python Rideshare App with Pyroscope
With simple case, you can handle pyroscope with python with easily some step
- Install python module which support for pyroscope
pip3 install pyroscope-io==0.8.5- Config environment variables for used by Pyroscope in application. Because we use
Dockerto operation project so you can pass variables into.env,docker-compose.yaml,dockerfileor set default inpython. First of all, you need to understanding what variables you need to set and choose for your expectation. (NOTICE: Each language has a separate set of values)
Python
import pyroscope

pyroscope.configure(
    application_name    = "my.python.app", # replace this with some name for your application
    server_address      = "http://my-pyroscope-server:4040", # replace this with the address of your Pyroscope server
    sample_rate         = 100, # default is 100
    detect_subprocesses = False, # detect subprocesses started by the main process; default is False
    oncpu               = True, # report cpu time only; default is True
    gil_only            = True, # only include traces for threads that are holding on to the Global Interpreter Lock; default is True
    enable_logging      = True, # does enable logging facility; default is False
    tags                = {
        "region": '{os.getenv("REGION")}',
    }
)
Configure the extension with the following environment variables and language
AWS Lambda

| Environment Variable | Default Value | Description |
|---|---|---|
PYROSCOPE_REMOTE_ADDRESS | https://profiles-prod-001.grafana.net | Destination for relayed Pyroscope data |
PYROSCOPE_BASIC_AUTH_USER | "" | HTTP Basic authentication user |
PYROSCOPE_BASIC_AUTH_PASSWORD | "" | HTTP Basic authentication password |
PYROSCOPE_SELF_PROFILING | false | Whether to profile the extension itself |
PYROSCOPE_LOG_LEVEL | info | Log level (error, info, debug, trace) |
PYROSCOPE_TIMEOUT | 10s | HTTP client timeout (in Go duration format) |
PYROSCOPE_NUM_WORKERS | 5 | Number of relay workers |
PYROSCOPE_TENANT_ID | "" | Pyroscope tenant ID (for multi-tenancy) |
.NET
| ENVIRONMENT VARIABLE | Type | DESCRIPTION |
|---|---|---|
PYROSCOPE_PROFILING_LOG_DIR | String | Sets the directory for .NET Profiler logs. Defaults to /var/log/pyroscope/. |
PYROSCOPE_LABELS | String | Static labels to apply to an uploaded profile. Must be a list of key:value separated by commas such as: layer:api or team:intake. |
PYROSCOPE_SERVER_ADDRESS | String | Address of the Pyroscope Server |
PYROSCOPE_PROFILING_ENABLED | Boolean | If set to true, enables the .NET Profiler. Defaults to false. |
PYROSCOPE_PROFILING_WALLTIME_ENABLED | Boolean | If set to false, disables the Wall time profiling. Defaults to false. |
PYROSCOPE_PROFILING_CPU_ENABLED | Boolean | If set to false, disables the CPU profiling. Defaults to true. |
PYROSCOPE_PROFILING_EXCEPTION_ENABLED | Boolean | If set to true, enables the Exceptions profiling. Defaults to false. |
PYROSCOPE_PROFILING_ALLOCATION_ENABLED | Boolean | If set to true, enables the Allocations profiling. Defaults to false. |
PYROSCOPE_PROFILING_LOCK_ENABLED | Boolean | If set to true, enables the Lock Contention profiling. Defaults to false. |
PYROSCOPE_BASIC_AUTH_USER | String | For HTTP Basic Authentication, use this to send profiles to authenticated server, for example Grafana Cloud |
PYROSCOPE_BASIC_AUTH_PASSWORD | String | For HTTP Basic Authentication, use this to send profiles to authenticated server, for example Grafana Cloud |
PYROSCOPE_TENANT_ID | String | Only needed if using multi-tenancy in Pyroscope. |
- With Python use can easily customize because It configuration will mapping into the python. In my case, I can config like
FROM python:3.11

WORKDIR /usr/src/app

#RUN adduser --disabled-password --gecos --quiet pyroscope
#USER pyroscope
USER root

RUN python -m pip install --upgrade pip
COPY main.py ./main.py

RUN pip install pyroscope-io

ENV PYROSCOPE_SERVER_ADDRESS=http://172.17.0.2:4040

CMD ["python", "main.py"]
#!/usr/bin/env python3
import logging
import os
import pyroscope
l = logging.getLogger()
l.setLevel(logging.DEBUG)
addr = os.getenv("PYROSCOPE_SERVER_ADDRESS")
print(addr)
pyroscope.configure(
application_name = "simple.python.app",
server_address = addr,
enable_logging = True,
)
def work(n):
i = 0
while i < n:
i += 1
def fast_function():
with pyroscope.tag_wrapper({ "function": "fast" }):
work(20000)
def slow_function():
with pyroscope.tag_wrapper({ "function": "slow" }):
work(80000)
if __name__ == "__main__":
while True:
fast_function()
slow_function()After that build to container with docker, just run command
docker build -t pyroscope-python:example-simple -f dockerfile .So run the container with command
docker run -d --name pyroscope-example pyroscope-python:example-simpleAfter that all things is connected, you can reach to the browser http://localhost:4040 or http://localhost:3000 and find application simple.python.app. Here is the result
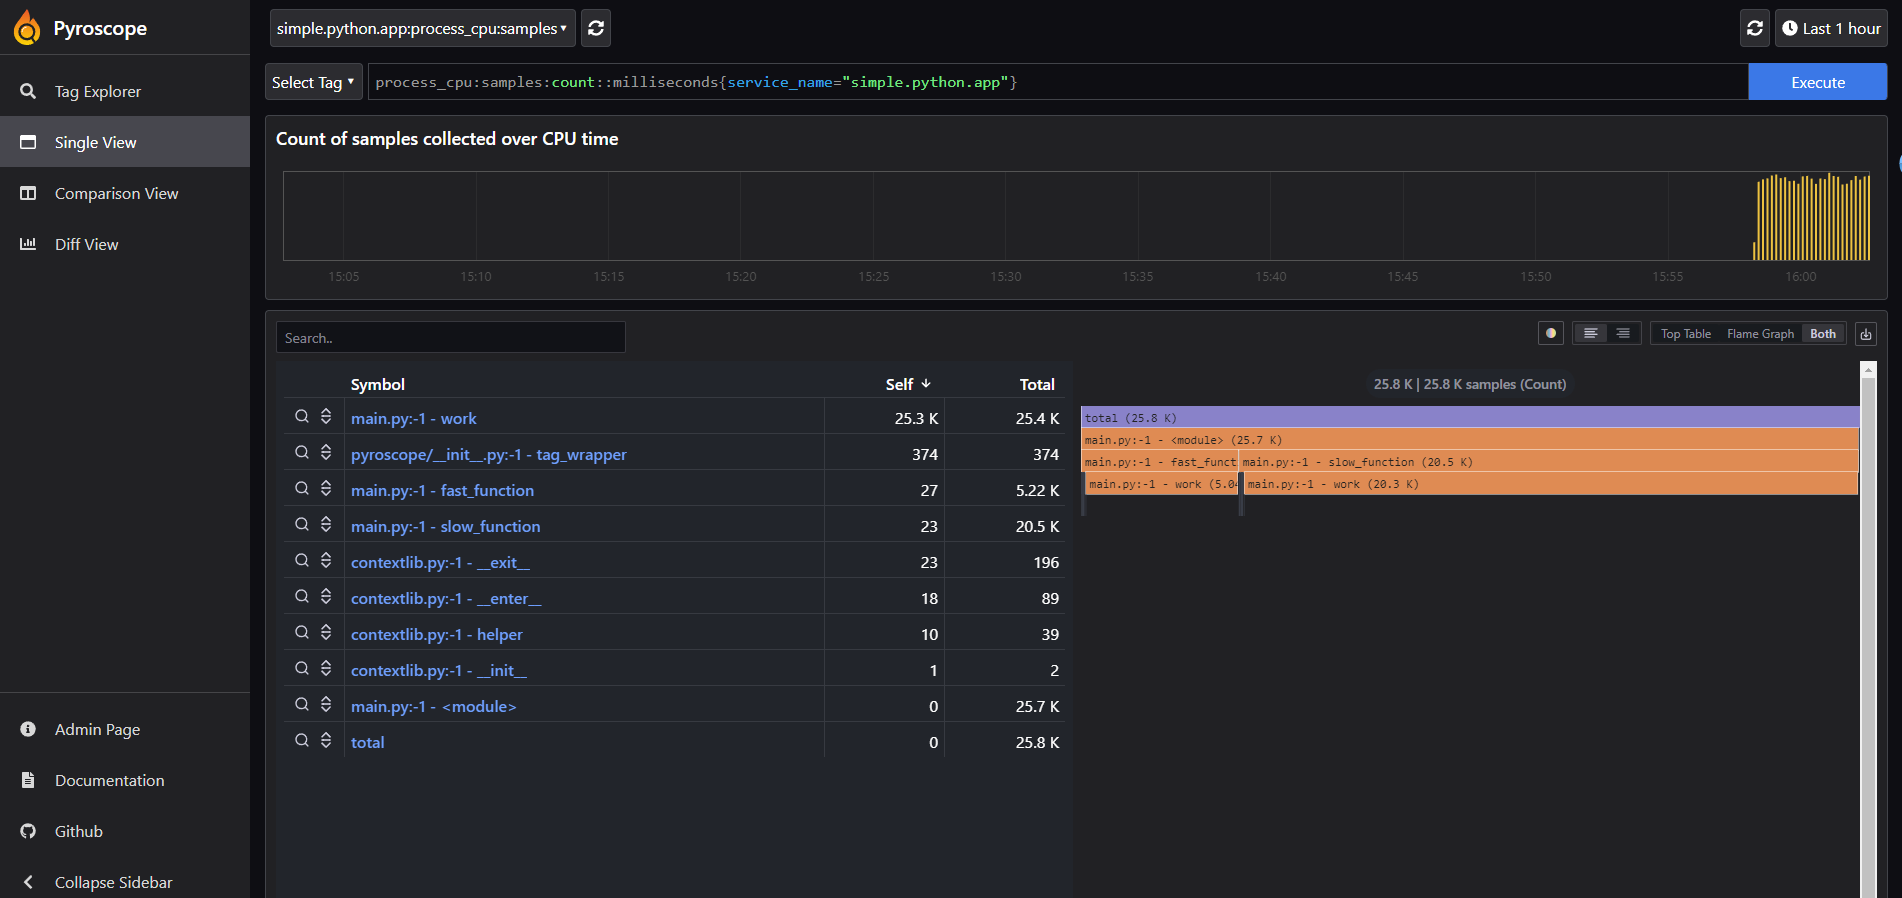
Pyroscope Dashboard
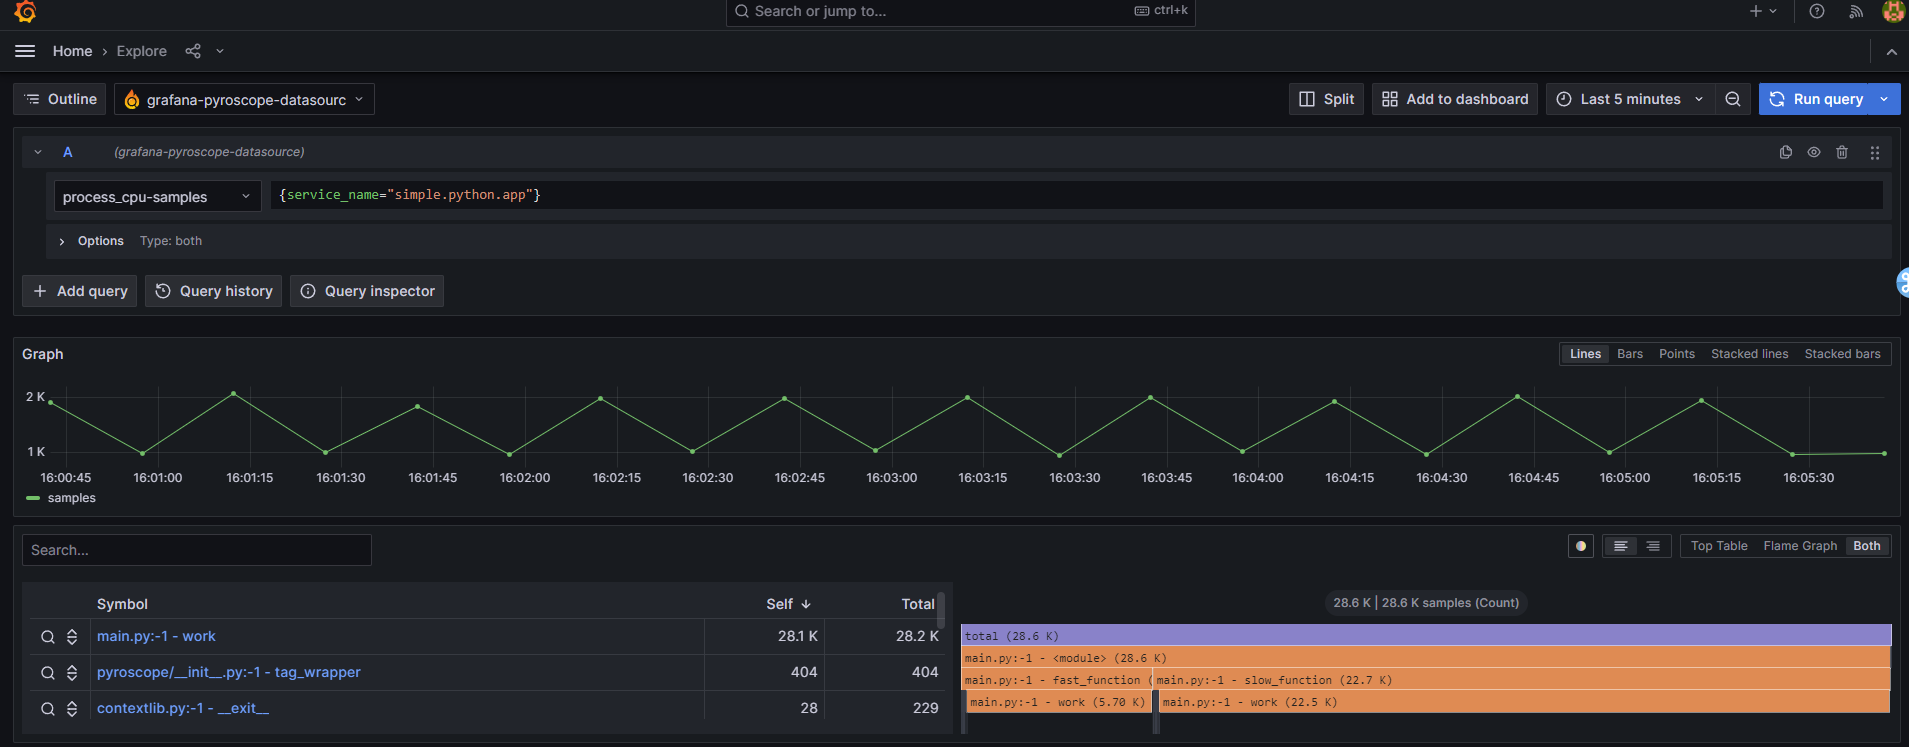
Grafana Dashboard
Example
This is quite simple application, but if you want more to understand and configuration. You can try with another example with python by multiple web-hosting framework of python like
flaskdjangofastapiExample: https://github.com/grafana/pyroscope/tree/release/v1.4/examples/python/rideshare
How we can understanding profiling
Info
To more understand, How we can figure out what configuration, param, report profiling in Pyroscope, Read more: https://grafana.com/docs/pyroscope/latest/view-and-analyze-profile-data/
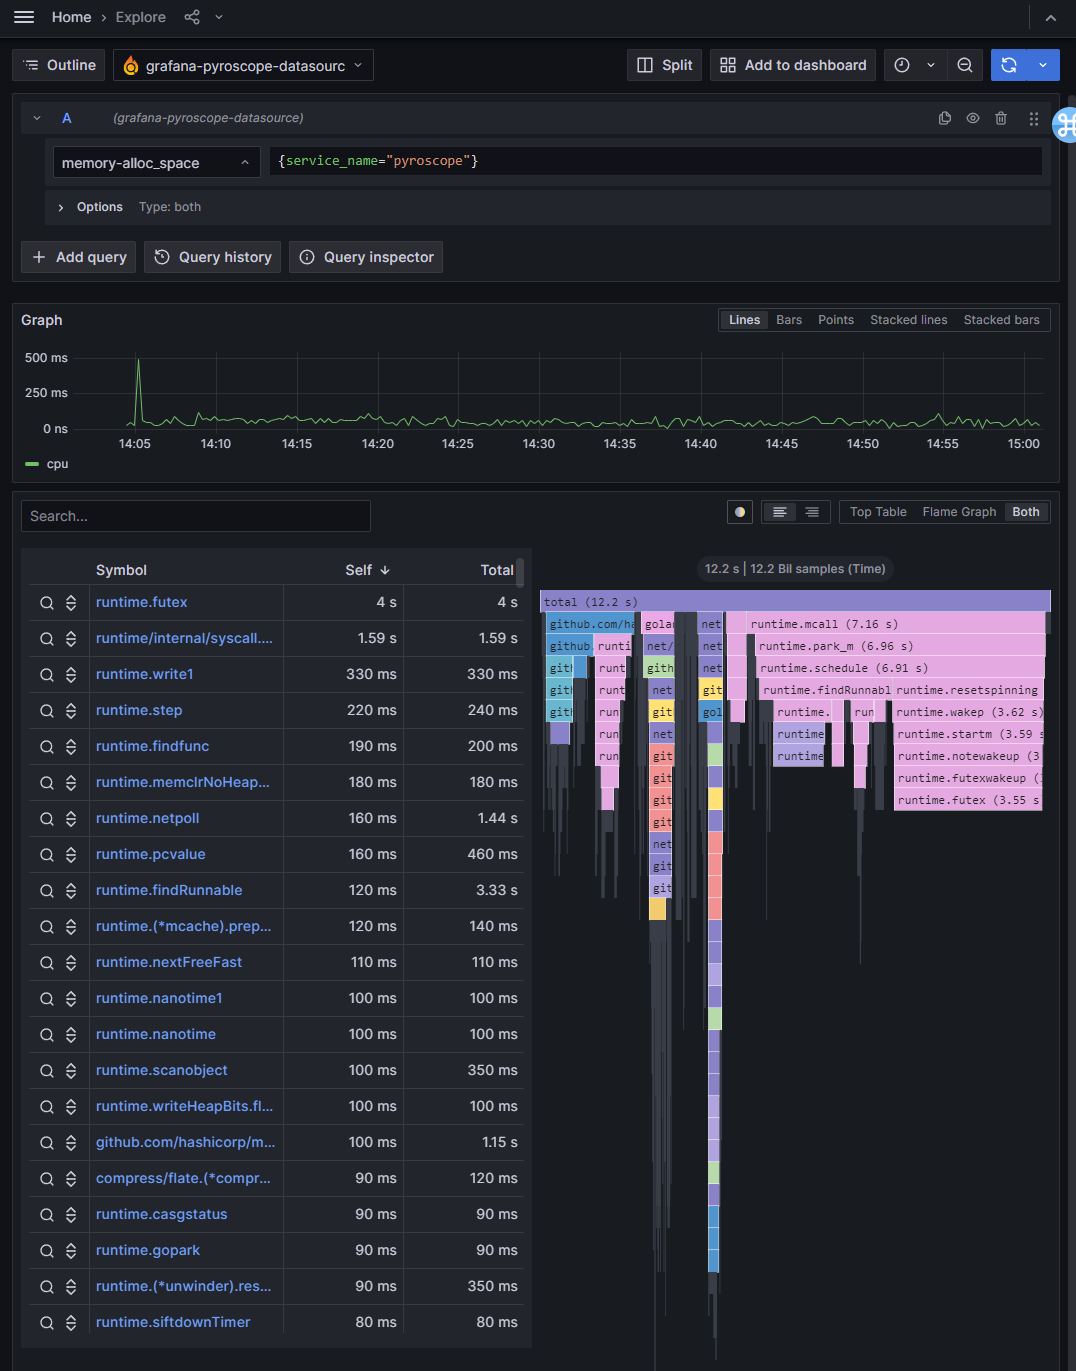
I just brief the documentation and focus how we can analysis the flamegraph to understand what It mean. Profiling data can be presented in a variety of formats presents such as:
- Flamegraphs: Visualize call relationships and identify hotspots.
- Tables: View detailed statistics for specific functions or time periods.
- Charts and graphs: Analyze trends and compare performance across different metrics.
Info
Pyroscope offers both a Command Line Interface (CLI) and an Application Programming Interface (API) to interact with and retrieve profiling data. These tools provide flexibility in how you access and manage your profiling information.
Available profile types (v1.2.0)
| Go | Java | .NET | Ruby | Python | Rust | Node.js | eBPF (Go) | eBPF (Python) |
|---|---|---|---|---|---|---|---|---|
| CPU | Yes | Yes | Yes | Yes | Yes | Yes | Yes | Yes |
| Alloc Objects | Yes | Yes | Yes | |||||
| Alloc Space | Yes | Yes | Yes | |||||
| Inuse Objects | Yes | |||||||
| Inuse Space | Yes | |||||||
| Goroutines | Yes | |||||||
| Mutex Count | Yes | Yes | ||||||
| Mutex Duration | Yes | Yes | ||||||
| Block Count | Yes | |||||||
| Block Duration | Yes | |||||||
| Lock Count | Yes | Yes | ||||||
| Lock Duration | Yes | Yes | ||||||
| Exceptions | Yes | |||||||
| Wall | Yes | |||||||
| Heap | Yes | |||||||
| Some specify type you can notice |
Info
For convenient way, profiling data usually visual via
flamegraph. These graphs provide a clear, intuitive understanding of resource allocation and bottlenecks within the application
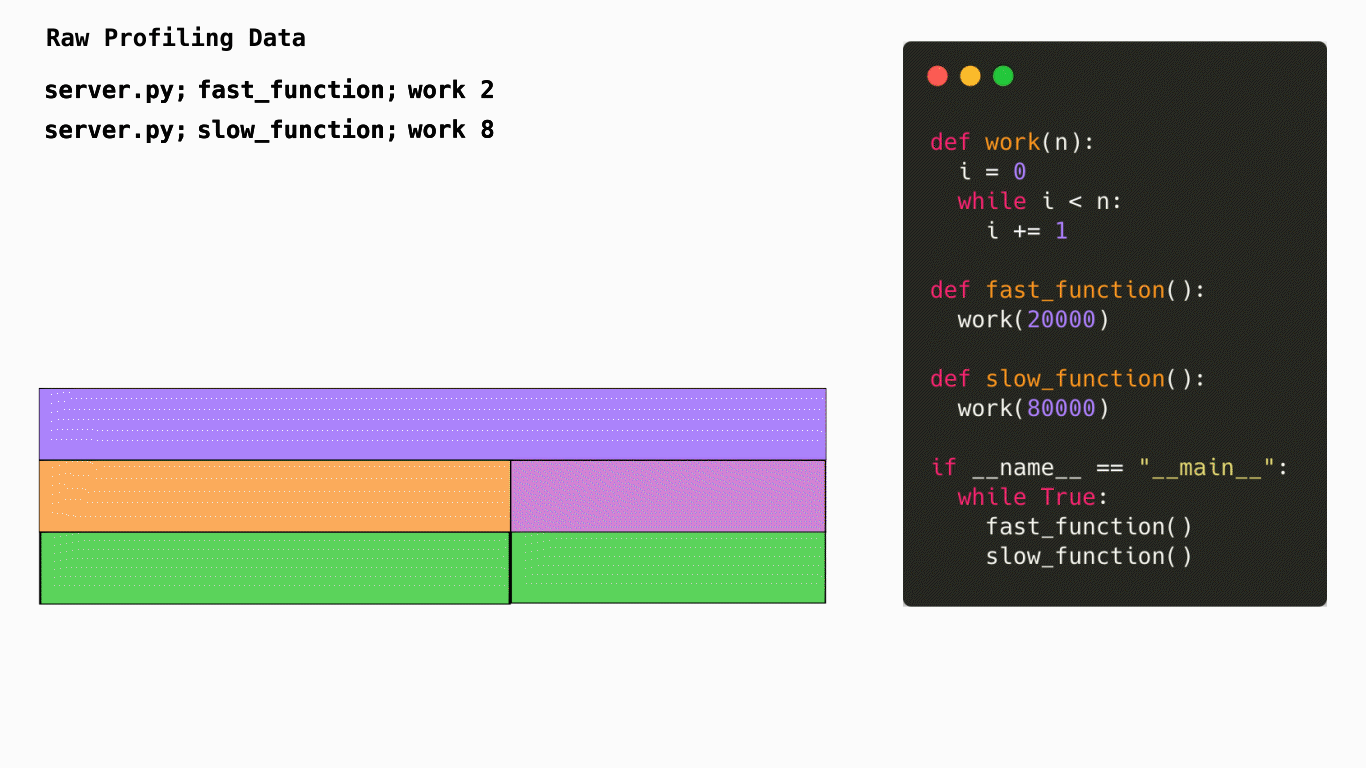
How is a flamegraph created?
When use read flamegraph, you must to read from head to bottom with corresponding to each stacktrace. Flamegraph above will show us how many CPU cycle use when run server.py 10. It will include slow_function work 8 represent work param(80000) and same as with fast_function work 2
Info
Horizontally, the flamegraph represents 100% of the time that this application was running. The width of each node represents the amount of time spent in that function. The wider the node, the more time spent in that function. The narrower the node, the less time spent in that function.
Vertically, the nodes in the flamegraph represent the heirarchy of which functions were called and how much time was spent in each function. The top node is the root node and represents the total amount of time spent in the application. The nodes below it represent the functions that were called and how much time was spent in each function. The nodes below those represent the functions that were called from those functions and how much time was spent in each function. This continues until you reach the bottom of the flamegraph.
This is a CPU profile, but profiles can represent many other types of resource such as memory, network, disk, etc.
From Flamegraphs: Visualizing performance data - https://grafana.com/
Conclusion
Abstract
So that all kind, I want to share with you about profiling, what technologies, What impression of mind with this one and how we can self-hosted that for your projects. Maybe on another session, we will digest into core functionality of profiling like
eBPFThanks again for Grafana and Pyroscope who contribute the cool things that support to developer, solution to increase performance, debug, … 👍👍👍👍
I hope you learn something, bye and have a good work 🙌🙌🙌 !!!