Quote
Hello everyone, it’s me again! I’m moving on to another topic in the HA Architecture with Database series. In this post, we won’t be covering the setup of any specific HA database. Instead, we’ll be diving into monitoring and observability—a crucial factor that allows you to effectively debug and remediate database issues. This area can be quite complex, so the key question is: where do we start? Let’s explore the topic!
The issues and where can we start ?

Question
Are you constantly asking yourself how to tackle technical issues within complex systems and services? Directly patching a problem without understanding its cause is always a mistake; it often costs significant time. This is where monitoring and observability become the heroes, providing the evidence you need to understand what is truly happening and giving you a clear starting point for debugging and remediation.
My strategy is to ensure that I always have sufficient evidence to prove the existence of any bugs or issues. In the field of technology, guessing is one of the hardest and least efficient approaches. This necessity emphasizes the importance of using specific tools to gather detailed information, especially concerning systems and databases.
To tackle these problems, Grafana and Prometheus consistently stand as the top choices for monitoring and observability, for the following reasons:
- Insane Capabilities: Their abilities are truly remarkable, and they can be described using terms like flexible, powerful, complex, and user-friendly. They support a wide range of tool integrations, intelligent dashboarding, built-in alert systems, and many other discoverable features.
- Exporter Ecosystem and Time-Series Data: You gain access to a vast ecosystem of Exporters. These are a fantastic option that allows you to monitor any system—from basic to complex—by scraping Metrics and saving them into Prometheus as a time-series database. You can then query this data powerfully using PromQL.
- Massive Scalability and Open Source Nature: Their limitations are truly massive, meaning they can handle a vast amount of data and services. Crucially, they are open-source and supported by a huge community, including the Cloud Native Computing Foundation (CNCF).
- Grafana’s Visualization Power: Speaking specifically about Grafana, it consistently provides many types of dashboards to visualize your metrics effectively. It is powerful while also offering a wealth of Pre-defined Dashboards that dramatically cut down on the time needed for provisioning your own, immediately delivering value.
The primary objective of this article is a practical deep dive into database monitoring using Prometheus and Grafana within a Kubernetes environment.
The learning and practical journey will cover the following key areas:
- Database Monitoring Setup: How to successfully deploy and configure Prometheus and Grafana to monitor your database instances within a Kubernetes cluster.
- Effective Dashboarding and Alerting: Setting up impactful dashboards and defining critical alerts to gain actionable insights. This capability is essential for guiding your next steps, maintaining control over your systems, and proactively addressing issues to prevent outages.
- Structured Deployment with Helm: Structuring the entire monitoring deployment using Helm, which offers a dynamic and flexible way to deploy, manage, and easily modify configuration parameters.
Each of these points will be detailed and addressed in the subsequent sections, leading us directly into the hands-on lab.
LabTime - Time to turn any things to reality

Warning
Since it’s impossible to demonstrate every necessary technique within a single article, I will assume you have the prerequisite setup complete or will provide references to external articles to offer a broader view for solving specific cases. Instead, I will focus exclusively on a simplified approach to setting up Monitoring and Observability and demonstrate how to use these tools to monitor the database in detail.
The experiment environment
Before you delve deeper into my provisioning version to setup monitoring stack, Prometheus and Grafana, you can double-check also these articles for more alternative ways and information
- Medium - How to Set Up Prometheus and Grafana in Kubernetes with Alertmanager and Slack Alerts ⇒ Using Lens IDE and
kube-prometheus-stack - DigitalOcean - How To Set Up a Kubernetes Monitoring Stack with Prometheus, Grafana and Alertmanager on DigitalOcean ⇒ Using DigitalOcean Kubernetes Service Monitoring Manifest
- DigitalOcean - How to Install Prometheus Monitoring Stack for DOKS Cluster 🌟 (Recommended)
- GitHub - kube-prometheus-stack 🌟 (Recommended)
- Grafana - Overview of Grafana Kubernetes Monitoring Helm chart 🌟 (Recommended)
- Blog - Devops Training Session 16: Setup Observability for Kubernetes
- dbi services - Setting Up Prometheus and Grafana for a Patroni cluster
To facilitate an easier approach and hands-on experience with this experiment, you should prepare the following prerequisites:
- Kubernetes Cluster: The choice of cluster is flexible, depending on whether you prefer a self-hosted solution or a cloud-based implementation. For self-hosting, I highly recommend lighter distributions such as Kind, K3s, or RKE2.
- Kubernetes Tools: You will need the standard command-line tools for Kubernetes management, specifically Helm and Kubectl.
Once your environment is ready, you can deploy the core monitoring stack. As discussed, I always prefer Prometheus and Grafana, which can be deployed together using the kube-prometheus-stack Helm chart.
This chart is the central tool for deploying a full Prometheus and Grafana cluster, which includes the Prometheus Operator. The Operator is a key component that will allow for dynamic configuration and simplifies the implementation of database monitoring, which we will address in the next section.
You have two primary options for deploying this Helm chart:
- Option 1 (Cloning and Modification): Clone the entire source code to your local host and directly modify the
values.yamlfile before deploying. - Option 2 (Chart Dependency): Use the Helm dependency management feature by defining
kube-prometheus-stackwithin thedependenciessection of your custom chart’sChart.yamlfile.
I prefer Option 1 for bootstrapping the monitoring stack because it is simpler and allows you to deploy your stack using a static file directly on your host. This gives you more immediate and granular control over the configuration without having to deal with the complexities of remote dependencies.
To quickly download only the necessary directory from the GitHub repository, I usually use Gitzip. It’s a simple tool for extracting specific directories. Alternatively, you can use git clone, but be aware that the kube-prometheus-stack repository is quite large and includes multiple files, which might occasionally lead to hitting rate limits if accessed frequently
After you are downloading successfully, you can customize a bit in values.yaml to setup this stack following yourself, but the default version is kinda complex so you need to aware to reservation a huge resource for your Kubernetes Cluster. I usually change
- Disable creating various things for monitoring and alert rules, like
etcd,controllerManger,schedulerorproxybecause it will self-hosted a lot of stuff not match with your Kubernetes, but you can refine it later
  kubeControllerManager:
    enabled: false
  kubeEtcd:
    enabled: false
  kubeScheduler:
    enabled: false
  kubeProxy:
    enabled: false
  defaultRules:
    rules:
      alertmanager: false
      kubeProxy: false
      kubeControllerManager: false
      etcd: false
      kubeSchedulerAlerting: false
kubeSchedulerRecording: false- Enable your
alertmanagerif you have plan to use this tool to push notification to any receivers, such asslack,rocketchat,webhook, …
  # Alert Manager configurations
  alertmanager:
    enabled: true
    alertmanagerSpec:
      portName: http-web
	# setup storage to keep your configuration after alert manager restart
    storage:
      volumeClaimTemplate:
        spec:
          accessModes:
          - ReadWriteOnce
          resources:
            requests:
              storage: 10Gi
          # `longhorn` or other class support your Kubernetes
          storageClassName: longhorn
    config:
      global: {}
      receivers:
        - name: rocketchat
          webhook_configs:
            - send_resolved: false
              url: rocket-chat-webhook
      route:
        group_by:
        - '...'
        group_interval: 5m
        group_wait: 45s
        receiver: rocketchat
        repeat_interval: 24h
        routes:
          - matchers:
            - alertname=~".*.*"
            receiver: rocketchat
    # Disable ingress because you shouldn't expose your alert-manager (Dangerous)
    ingress:
enabled: false- Update configuration to deploy your Grafana, it will call dependencies from Grafana Helm Chart, therefore I usually keep in simple like this but you can define more following related chart
  # Grafana configurations
  grafana:
    adminPassword: secret-password-for-yourself
    ingress:
      # Enable ingress to expose your grafana service
      enabled: true
	  ingressClassName: nginx
      hosts:
      # Define your own domain
      - grafana.example.xyz
    # Disable ownership for run with arbitrary user
    initChownData:
      enabled: false
    # Setup pv for keeping the configuration when restart grafana
    persistence:
      accessModes:
      - ReadWriteOnce
      enabled: true
      size: 3Gi
storageClassName: longhorn- Setup Prometheus Service
  prometheus:
	# Disable ingress for not expose prometheus service
	# we will use internal instead in Kubernetes
    ingress:
      enabled: false
    prometheusSpec:
	  # Add a couple of exporter, you can use this for monitoring, but I will guide you another solution instead
	  # For example: using to scrape `kubernetes-hami-exporter`
	  # Read more at: https://prometheus.io/docs/prometheus/latest/configuration/configuration/#scrape_config
      additionalScrapeConfigs:
      - job_name: 'kubernetes-hami-exporter'
        kubernetes_sd_configs:
          - role: endpoints
            namespaces:
              own_namespace: false
              names:
              - kube-system
        relabel_configs:
          - source_labels: [__meta_kubernetes_endpoints_name]
            regex: hami-device-plugin-monitor
            replacement: $1
            action: keep
          - source_labels: [__meta_kubernetes_pod_node_name]
            regex: (.*)
            target_label: node_name
            replacement: ${1}
            action: replace
          - source_labels: [__meta_kubernetes_pod_host_ip]
            regex: (.*)
            target_label: ip
            replacement: $1
            action: replace
      ## How long to retain metrics
      retention: 2d
      # Set pv for keep your metrics on-track for query and storing your configuration
      storageSpec:
        volumeClaimTemplate:
          spec:
            accessModes:
            - ReadWriteOnce
            resources:
              requests:
                storage: 20Gi
storageClassName: longhorn- Enable Prometheus Operator which to let you dynamically configuration prometheus for extend exporters
  prometheusOperator:
    enabled: true
    admissionWebhooks:
      failurePolicy: Ignore
    networkPolicy:
      enabled: false
Now you are ready to deploy the first version of kube-prometheus-stack in your current directory
# Run the dependency update to pull another chart for your deployment
helm dependency update ./
helm upgrade --install kube-prometheus-stack ./ -n monitoring --create-namespace -f values.yamlHelm Structure for Database Monitoring Stack
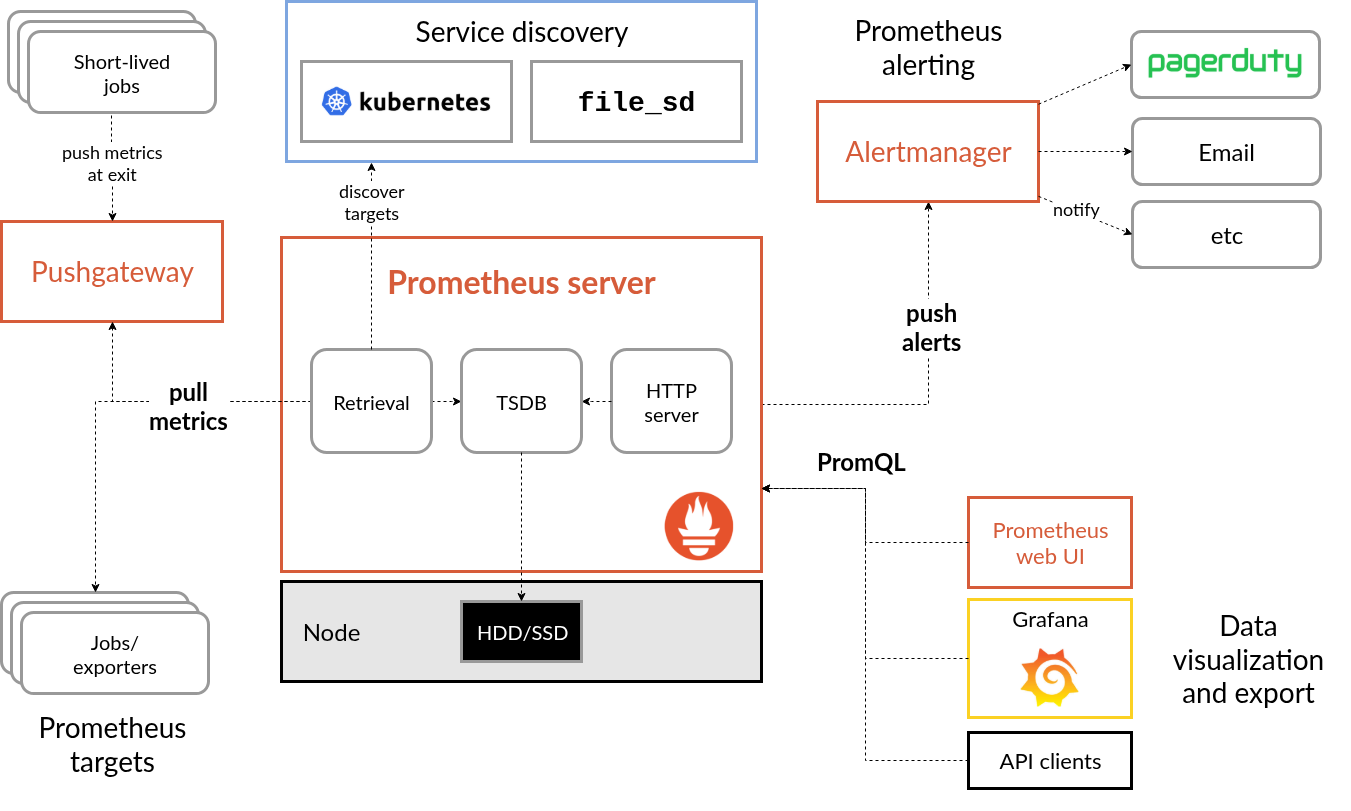
Source: Prometheus
After successfully bootstrapping your Kubernetes cluster with the kube-prometheus-stack, the next step is to deploy the necessary Exporters to achieve comprehensive monitoring of your multiple databases, especially your HA Database Clusters.
The standard approach for monitoring involves exposing metrics that Prometheus can scrape, store, and make queryable via PromQL. This is precisely the solution for setting up your database monitoring.
Here is a double-check on the Exporters you have selected and what metrics they expose for each database:
For PostgreSQL, I use two sources to cover both database-level and cluster-level HA metrics:
- Prometheus PostgreSQL Exporter:
- Focus: PostgreSQL Database Metrics.
- Key Metrics Exposed: This exporter executes SQL queries against your PostgreSQL instance, e.g pg_stat_activity to provide detailed metrics on:
- Database Statistics: Size, number of active connections.
- Query Performance: Query execution times, transactions committed/rolled back.
- Replication Status: Lag between primary and replicas (crucial for HA).
- Table/Index Stats: Hit ratios, bloat, etc.
- Patroni Endpoint:
- Focus: Patroni (HA/Clustering) Status Metrics.
- Key Metrics Exposed: If you are using Patroni for PostgreSQL HA, this endpoint (usually
/patroniand/metrics) provides essential information on:- Role Status: Whether a node is a
master,replica, orcandidate. - Replication Lag: Health check of the Patroni-managed replication.
- Cluster Health: Overall status of the Patroni cluster.
- Role Status: Whether a node is a
For MongoDB, I will use only exporter because the built-in metrics expose enough, or too many value for showing you state of database and replicaset
- Percona MongoDB Exporter:
- Focus: MongoDB Instance and Replica Set Metrics.
- Key Metrics Exposed: This exporter gathers metrics from MongoDB’s server status and replica set status commands to provide:
- Server Status: Connections, network traffic, memory usage.
- Operation Counts: Inserts, updates, deletes, queries, commands.
- Replica Set Status: Member state (PRIMARY, SECONDARY), election activity, and replication lag (essential for HA health).
- Oplog Window: Metrics on the operation log size and time window.
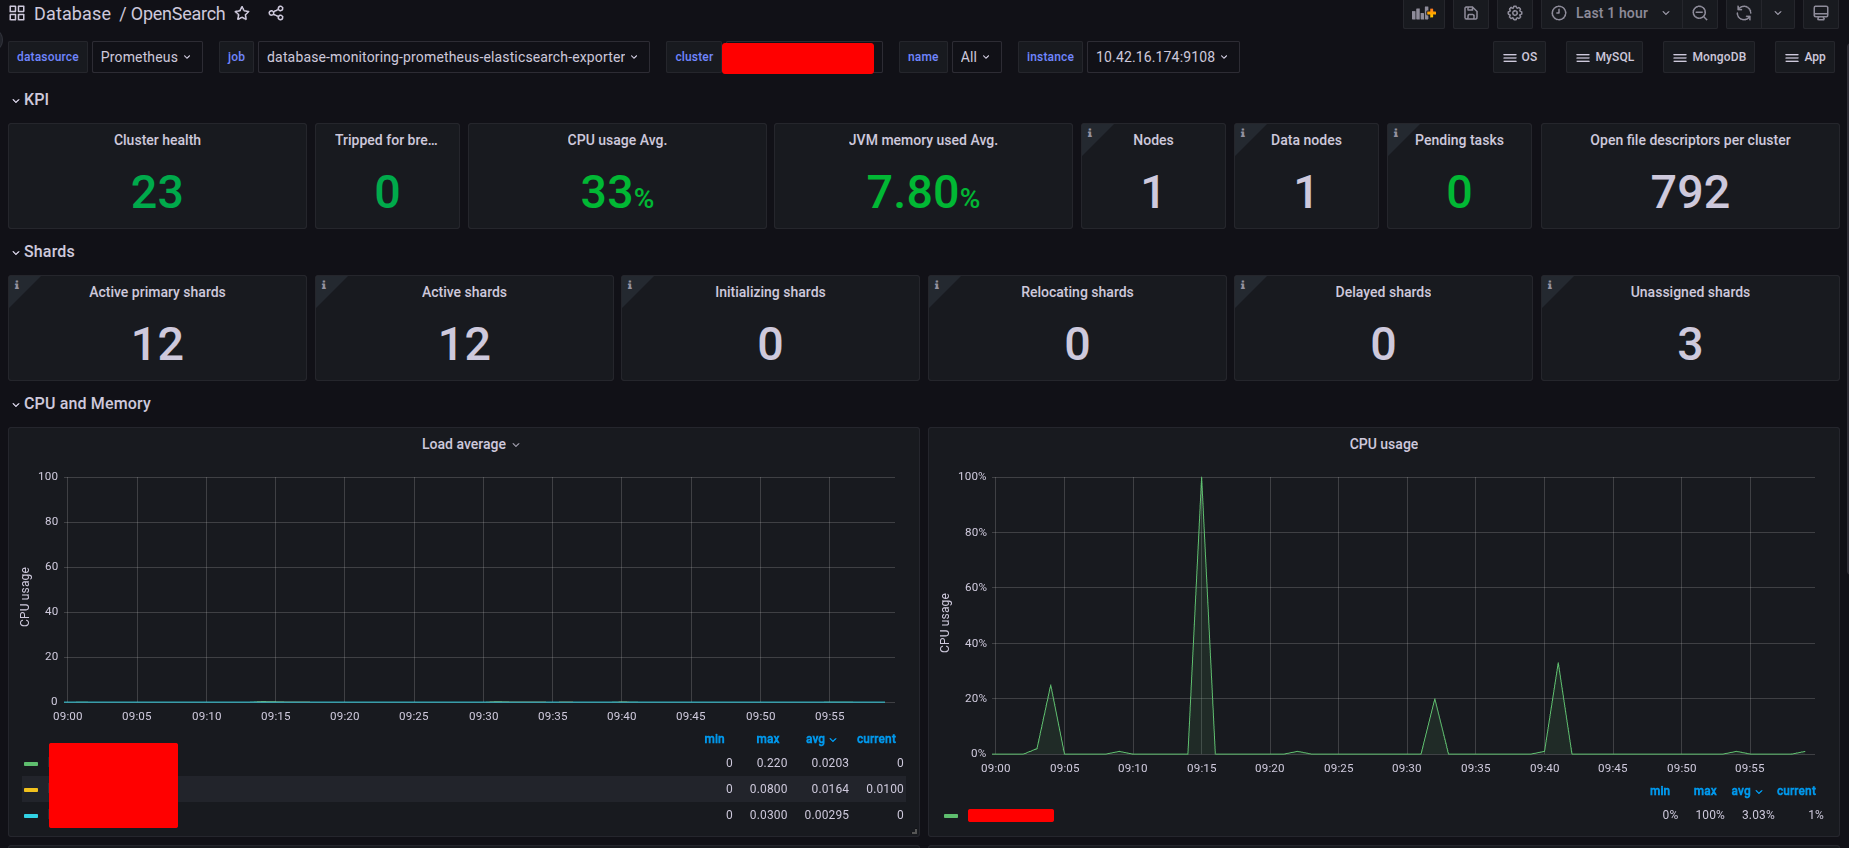
For OpenSearch and ElasticSearch, same page as MongoDB, I use only exporter to expose enough information of target
- Prometheus ElasticSearch Exporter:
- Focus: OpenSearch/Elasticsearch Cluster and Node Metrics.
- Key Metrics Exposed: This tool exposes metrics about the overall state and performance of the cluster:
- Cluster Health: Status (green, yellow, red), number of nodes, number of active/initializing/unassigned shards.
- Node Metrics: CPU, JVM heap usage, thread pool statistics.
- Indexing/Search Performance: Total and current requests for indexing and searching.
- Disk Usage: Shard sizes and disk availability.
By deploying these specific Exporters alongside your databases and configuring the kube-prometheus-stack to scrape them (typically via ServiceMonitor resources provided by the Prometheus Operator), you will have all the necessary metrics to build detailed dashboards and alerts for your entire HA database landscape.
Let’s clarify the role of the Prometheus Operator, which significantly changes how you manage your monitoring stack separate from the Prometheus and Grafana applications themselves.
When you deploy the kube-prometheus-stack, you are installing this operator. It allows you to leverage powerful, custom Kubernetes resource types with the API group monitoring.coreos.com/v1, making your monitoring configuration Kubernetes-native.
The two critical resources this operator provides are:
PrometheusRule: This resource allows you to define your Prometheus alerting and recording rules using standard YAML configuration. The Operator automatically loads these rules into your running Prometheus instance.ServiceMonitor: This resource defines the target endpoints (Services) from which your Prometheus instance should scrape metrics. This is the key to dynamically discovering and connecting to Exporters deployed throughout your cluster.
These two resources form the backbone strategy for managing and operating database monitoring. They simplify the approach immensely because you avoid the unstable and non-best practice method of directly editing the static Prometheus configuration file and repeatedly restarting the service for testing. Adopting the Operator instead makes your monitoring setup dynamic, manageable, and highly stable.
Back to the setup process, I will show you each file in directory to let imagine what thing need to do for prepare deployment with helm, and I will go with option two to use remote dependencies instead of clone to local
.
├── Chart.yaml
├── .helmignore
├── templates
│   ├── mongodb-prometheus-rules.yaml
│   └── patroni-prometheus.yaml
└── values.yaml

2 directories, 5 files
Because this chart will pre-definition version so try list all of your dependencies in Chart.yaml
apiVersion: v2
name: database-monitoring
type: application
appVersion: 0.1.0
version: 0.1.0
dependencies:
  - name: prometheus-postgres-exporter
    version: 6.10.2
    repository: https://prometheus-community.github.io/helm-charts
    condition: "prometheus-postgres-exporter.enabled"
  - name: prometheus-mongodb-exporter
    version: 3.12.0
    repository: https://prometheus-community.github.io/helm-charts
    condition: "prometheus-mongodb-exporter.enabled"
  - name: prometheus-elasticsearch-exporter
    version: 6.7.3
    repository: https://prometheus-community.github.io/helm-charts
    condition: "prometheus-elasticsearch-exporter.enabled"
As you can see, we only defined the necessary dependencies for this Helm chart because the Patroni endpoint will be defined as an external Kubernetes Service to receive metrics directly from the PostgreSQL HA cluster, eliminating the need for a separate Exporter for cluster health.
Next, I will walk through each database type and detail which parameters in the values.yaml file you need to modify to define your own monitoring configuration corresponding to each database.
PostgreSQL
For PostgreSQL, as usual I copy the original version values file of PostgreSQL Exporter Helm Chart to start the modification
Because we use the dependencies and use the condition prometheus-postgres-exporter.enabled to enable and disable chart, therefore you should define enabled key, like this
prometheus-postgres-exporter:
  # Enable and disable your exporter
  enabled: true
  replicaCount: 1
I truly recommend you to modify the tag of the image, because it keeps your exporter on same version after restart and you can prevent misconception every single this exporter run again
  image:
    registry: quay.io
    repository: prometheuscommunity/postgres-exporter
    # if not set appVersion field from Chart.yaml is used
    tag: "v0.17.1"
    pullPolicy: IfNotPresent
Enable servicemonitor to let you proemtheus can scrape your exporter endpoint
  serviceMonitor:
    # When set true then use a ServiceMonitor to configure scraping
    enabled: true
    # Set the namespace the ServiceMonitor should be deployed
    namespace: monitoring
    # Set how frequently Prometheus should scrape
    interval: 30s
    # Set path to cloudwatch-exporter telemtery-path
    telemetryPath: /metrics
    # Set labels for the ServiceMonitor, use this to define your scrape label for Prometheus Operator
    labels: []
    # Set timeout for scrape
    timeout: 10s
    # Set of labels to transfer from the Kubernetes Service onto the target
    targetLabels: []
    # MetricRelabelConfigs to apply to samples before ingestion
    metricRelabelings: []
    # Set relabel_configs as per https://prometheus.io/docs/prometheus/latest/configuration/configuration/#relabel_config
    relabelings: []
    # HTTP scheme to use for scraping. For example `http` or `https`. Default is `http`.
    scheme: http
    # TLS configuration to use when scraping the metric endpoint by Prometheus.
    tlsConfig: {}

    # Use multipleTarget mode
    multipleTarget:
      enabled: false
      # Use the same auth module for every target
      # The config file should have a section like [$name]
      sharedAuthModule:
        enabled: false
        name: ""

      # Define each target's endpoint and name
      # When not using sharedAuthModule the config file should have one authModule for each target with key "client.$name"
      targets:
        []
        # - endpoint: pg01.local
        #   name: pg01 (there needs to exist an authModule with key "client.pg01" if not using sharedAuthModule)
        #   port: default 5432
        #   databaseName: default '' (Set the database name to connect to)
Next enable prometheusRule for define your alert in prometheus, I only serve couple of important rules to announce the state of your database
- PostgresqlDown
- PostgresqlRestarted
- PostgresqlTooManyConnections
- PostgresqlDeadLocks
Note
Because this rule definition can lead to error about syntax, I try to add couple add-on
double-quote ("")andbacktick (``)to help helm able to parse these rules to strings and compatible with helm syntax. Explore more about how to backtick to solve problem at - StackOverFlow - How an helm chart have an attribute with value contain {{ }}
  prometheusRule:
    enabled: true
    additionalLabels: {}
    namespace: "monitoring"
    rules:
      ## These are just examples rules, please adapt them to your needs.
      ## Make sure to constraint the rules to the current prometheus-postgres-exporter service.
    - alert: PostgresqlDown
      expr: pg_up == 0
      for: 0m
      labels:
        severity: critical
      annotations:
        summary: "Postgresql down (instance {{`{{ \"$labels.instance\" }}`}})"
        description: "Postgresql instance is down\n  VALUE = {{`{{ \"$value\" }}`}}\n  LABELS = {{`{{ \"$labels\" }}`}}"

    - alert: PostgresqlRestarted
      expr: time() - pg_postmaster_start_time_seconds < 60
      for: 0m
      labels:
        severity: critical
      annotations:
        summary: "Postgresql restarted (instance {{`{{ \"$labels.instance\" }}`}})"
        description: "Postgresql restarted\n  VALUE = {{`{{ \"$value\" }}`}}\n  LABELS = {{`{{ \"$labels\" }}`}}"

    - alert: PostgresqlTooManyConnections
      expr: sum by (instance, job, server) (pg_stat_activity_count) > min by (instance, job, server) (pg_settings_max_connections * 0.8)
      for: 2m
      labels:
        severity: warning
      annotations:
        summary: "Postgresql too many connections (instance {{`{{ \"$labels.instance\" }}`}})"
        description: "PostgreSQL instance has too many connections (> 80%).\n  VALUE = {{`{{ \"$value\" }}`}}\n  LABELS = {{`{{ \"$labels\" }}`}}"

    - alert: PostgresqlDeadLocks
      expr: increase(pg_stat_database_deadlocks{datname!~"template.*|postgres"}[1m]) > 5
      for: 0m
      labels:
        severity: warning
      annotations:
        summary: "Postgresql dead locks (instance {{`{{ \"$labels.instance\" }}`}})"
        description: "PostgreSQL has dead-locks\n  VALUE = {{`{{ \"$value\" }}`}}\n  LABELS = {{`{{ \"$labels\" }}`}}"

    - alert: PatroniFailoverOccurred
      expr: |
        sum by (scope) (
          changes(patroni_primary[1m])
        ) > 0
      for: 0m
      labels:
        severity: warning
      annotations:
        summary: "Patroni Failover/Switchover Occurred"
        description: "A failover or switchover just occurred in Patroni cluster {{`{{ \"$labels.scope\" }}`}}. A new primary has been elected."
Next you need enable to create your service-account for this exporter and put them into namespace, it should be same with prometheus namespace
  serviceAccount:
    # Specifies whether a ServiceAccount should be created
    create: true
    # The name of the ServiceAccount to use.
    # If not set and create is true, a name is generated using the fullname template
    name: prometheus-postgres-exporter
    # Add annotations to the ServiceAccount, useful for EKS IAM Roles for Service Accounts or Google Workload Identity.
    annotations: {}

  # Force namespace of namespaced resources
  namespaceOverride: "monitoring"
Finally, we configured the settings for monitoring your PostgreSQL instance. This setup involves defining the following parameters for the Exporter:
host: The network address of your PostgreSQL server.userandpassword: The credentials for the Exporter to connect.- NOTE: For production readiness, you should use a Kubernetes
Secretinstead of passing these values directly. - Security Best Practice: The monitoring user should not be the superuser/root. You must follow the guide at Running as non-superuser to set up a dedicated, non-superuser account with minimal required permissions.
- NOTE: For production readiness, you should use a Kubernetes
database: The name of the database to connect to, typicallypostgres.port: The connection port.- HA Cluster Note: If you are using a load balancer like HAProxy to manage your HA Cluster, update the port to the HAProxy’s frontend port (e.g.,
5000) to ensure metrics are read consistently, ideally from the Primary node.
- HA Cluster Note: If you are using a load balancer like HAProxy to manage your HA Cluster, update the port to the HAProxy’s frontend port (e.g.,
sslmode: Should be changed fromdisabletorequireif your database connection has SSL/TLS encryption enabled.
config:
  ## The datasource properties on config are passed through helm tpl function.
  ## ref: https://helm.sh/docs/developing_charts/#using-the-tpl-function
  datasource:
    # Specify one of both datasource or datasourceSecret
    host: ''
    user: postgres
    # Specify userFile if DB username is stored in a file.
    # For example, to use with vault-injector from Hashicorp
    userFile: ''
    userSecret: {}
    # Secret name
    #  name:
    # User key inside secret
    #  key:
    # Only one of password, passwordFile, passwordSecret and pgpassfile can be specified
    password:
    # Specify passwordFile if DB password is stored in a file.
    # For example, to use with vault-injector from Hashicorp
    passwordFile: ''
    # Specify passwordSecret if DB password is stored in secret.
    passwordSecret: {}
    # Secret name
    #  name:
    # Password key inside secret
    #  key:
    pgpassfile: ''
    # If pgpassfile is set, it is used to initialize the PGPASSFILE environment variable.
    # See https://www.postgresql.org/docs/14/libpq-pgpass.html for more info.
    port: "5000"
    database: ''
    sslmode: disable
    extraParams: ''
  datasourceSecret: {}
    # Specifies if datasource should be sourced from secret value in format: postgresql://login:password@hostname:port/dbname?sslmode=disable
    # Multiple Postgres databases can be configured by comma separated postgres connection strings
    # Secret name
    #  name:
    # Connection string key inside secret
    #  key:
  disableCollectorDatabase: false
  disableCollectorBgwriter: false
  disableDefaultMetrics: false
  disableSettingsMetrics: false

  # possible values debug, info, warn, error, fatal
  logLevel: ""
  # possible values logfmt, json
  logFormat: ""
  extraArgs: []

  # postgres_exporter.yml
  postgresExporter: ""
    # auth_modules:
    #   first:
    #     type: userpass
    #     userpass:
    #       username: first
    #       password: firstpass
    #     options:
    #       sslmode: disable

  # define an existing secret to be mounted as the config file
  # needs to have the key 'postgres_exporter.yml'
  existingSecret:
    enabled: false
    name: ""
You can keep the remaining values in the values.yaml file at their original default settings. This minimal configuration is sufficient to successfully operate the prometheus-postgres-exporter via Helm.
We will execute this deployment action only after we have successfully defined the monitoring configurations for the entire database stack.
Patroni
Next, we’ll define the monitoring for the Patroni cluster that manages your HA PostgreSQL. The approach here is different because we won’t use a standard Exporter Pod; instead, we’ll apply a Kubernetes technique called Service without Selector or Use service without selector
This technique requires you to manually define both an external Service and an Endpoint resource. This allows Kubernetes to understand and route traffic to your remote Patroni monitoring endpoint, which exposes metrics directly.
To complete this setup, we will also provide a Helm template for rendering both the necessary ServiceMonitor and PrometheusRule resources.
In the templates folder of your Helm chart, I will define a new manifest template that includes all the necessary resources for integrating the Patroni endpoint:
{{- if and (eq .Values.patroni.enabled true) (gt (len .Values.patroni.nodes) 0) }}
---
apiVersion: v1
kind: Service
metadata:
  name: "{{ .Release.Name }}-external-patroni"
  namespace: {{ .Values.patroni.namespace }}
  labels:
    app.kubernetes.io/instance: {{ .Release.Name }}
    app.kubernetes.io/name: external-patroni
spec:
  ports:
    - protocol: TCP
      port: {{ .Values.patroni.port }}
      targetPort: {{ .Values.patroni.port }}
      name: patroni-rest
---
apiVersion: v1
kind: Endpoints
metadata:
  name: "{{ .Release.Name }}-external-patroni"
  namespace: {{ .Values.patroni.namespace }}
  labels:
    app.kubernetes.io/instance: {{ .Release.Name }}
    app.kubernetes.io/name: external-patroni
subsets:
  - addresses:
      {{- range .Values.patroni.nodes }}
      - ip: {{ .endpoint }}
      {{- end }}
    ports:
      - port: {{ .Values.patroni.port }}
        name: patroni-rest
---
apiVersion: monitoring.coreos.com/v1
kind: ServiceMonitor
metadata:
  name: {{ .Release.Name }}-patroni-metrics-exporter
  namespace: {{ .Values.patroni.namespace }}
spec:
  # Selector to find the Kubernetes Service that points to the Patroni pods.
  selector:
    matchLabels:
      app.kubernetes.io/instance: {{ .Release.Name }}
      app.kubernetes.io/name: external-patroni # Update this label to match your Patroni service labels

  # Select the namespace where the Patroni service is located.
  namespaceSelector:
    matchNames:
      - {{ .Values.patroni.namespace }} # Replace 'default' with your Patroni namespace (e.g., 'database')

  # Configuration for the scrape endpoint(s).
  endpoints:
    - port: patroni-rest # MUST match the *name* of the port (8008) in the Patroni Service definition.
      # The path to hit for Patroni status/health information.
      path: {{ .Values.patroni.serviceMonitor.path }}
      # Set scheme to 'https' as requested.
      scheme: {{ .Values.patroni.serviceMonitor.scheme }}
      # Set a reasonable scrape interval.
      interval: {{ .Values.patroni.serviceMonitor.interval }}
      # Set a timeout for scraping
      scrapeTimeout: {{ .Values.patroni.serviceMonitor.scrapeTimeout }}

      # --- TLS Configuration (CRUCIAL for HTTPS) ---
      tlsConfig:
        # If your Patroni cluster uses self-signed certificates or certificates
        # not issued by a known CA within the cluster, set this to true.
        # WARNING: This bypasses certificate verification and is less secure.
        insecureSkipVerify: true

        # If you have a mounted CA certificate for verification, use this instead:
        # ca:
        #   name: patroni-certs
        #   key: ca.crt
        # If you need client certificate authentication:
        # cert:
        #   name: prometheus-client-certs
        #   key: client.crt
        # keySecret:
        #   name: prometheus-client-certs
        #   key: client.key
      # ----------------------------------------------
{{- if .Values.patroni.prometheusRule.enabled }}
---
apiVersion: monitoring.coreos.com/v1
kind: PrometheusRule
metadata:
  name: {{ .Release.Name }}-patroni-metrics-exporter
  namespace: {{ .Values.patroni.namespace }}
  labels:
{{- with .Values.patroni.prometheusRule.additionalLabels }}
{{ toYaml . | indent 4 }}
{{- end }}
spec:
{{- with .Values.patroni.prometheusRule.rules }}
  groups:
    - name: patroni-metrics-exporter
      rules: {{ tpl (toYaml .) $ | nindent 8 }}
{{- end }}
{{- end }}
{{- end }}
Now back to the values.yaml file and we will also define the value for patroni
# Using for monitoring patroni endpoint of HA PostgreSQL Cluster
patroni:
  # Set enable for patroni monitoring in your remote host
  enabled: false
  # Set monitoring for node correspond each endpoint in cluster
  nodes:
    - name: postgres-01
      endpoint: 192.168.69.96
    - name: postgres-02
      endpoint: 192.168.69.97
    - name: postgres-03
      endpoint: 192.168.69.98
  # Port of Patroni RestAPI
  port: 8008
  # Namespace to create and monitor patroni in cluster
  namespace: monitoring
  # Setup the service monitor for scraping by Prometheus
  serviceMonitor:
    # Metrics path/endpoint where patroni expose the metrics of cluster
    path: /metrics
    # Set time interval for scraping
    interval: 15s
    # Set timeout for scraping
    scrapeTimeout: 10s
    # Set scheme for connect to patroni metrics endpoint, if https is set, it will try to use insecureSkipVerify
    scheme: https
  # Setup the prometheus rule for patroni
  prometheusRule:
    # Set enable for these rules definition
    enabled: false
    # Additional label for these rules
    additionalLabels: {}
    # The rules definition to let prometheus setup
    rules: {}
    # - alert: PatroniHasNoLeader
    #   expr: (max by (scope) (patroni_master) < 1) and (max by (scope) (patroni_standby_leader) < 1)
    #   for: 0m
    #   labels:
    #     severity: critical
    #   annotations:
    #     summary: Patroni has no Leader (instance {{ $labels.instance }})
    #     description: "A leader node (neither primary nor standby) cannot be found inside the cluster {{`{{ $labels.scope }}`}}\n  VALUE = {{`{{ $value }}`}}\n  LABELS = {{`{{ $labels }}`}}"
This configuration will deploy the necessary Service resources to dynamically scrape multiple Patroni node endpoints within your HA PostgreSQL cluster. This ensures you are able to continuously monitor the health and status of both the primary and all secondary nodes. You can easily scale this by adding more endpoints if your Patroni cluster grows beyond three nodes.
For alerting, I will group these Patroni-specific rules with the existing PostgreSQL PrometheusRule group for simplified management and centralized notification. However, if you prefer a separate and distinct notification channel or rule set for cluster health, you can un-comment and define the rules within the dedicated patroni.prometheusRule configuration.
    - alert: PatroniFailoverOccurred
      expr: |
        sum by (scope) (
          changes(patroni_primary[1m])
        ) > 0
      for: 0m
      labels:
        severity: warning
      annotations:
        summary: "Patroni Failover/Switchover Occurred"
        description: "A failover or switchover just occurred in Patroni cluster {{`{{ \"$labels.scope\" }}`}}. A new primary has been elected."
MongoDB
Same as PostgreSQL, I also copy the original values.yaml from Prometheus MongoDB Exporter Helm Chart and modification a couple values in that file. Also you need to define the value prometheus-mongodb-exporter.enabled to let your dependencies work as perfectly
prometheus-mongodb-exporter:
  enabled: true
First of all, because we change the architecture of MongoDB from standalone to replicaSet, but by default, Percona MongoDB Exporter only approve for direct-connect, therefore if you want to change that into cluster mode for your exporter, you can add-on args into runtime-command. Explore more at GitHub Issue - Cannot connect to MongoDB
  # Extra environment variables that will be passed into the exporter pod
  env: {}

  extraArgs:
    - --collect-all
    - --no-mongodb.direct-connect
Secondly, I always recommend you to set the specific tag for your container, it will keep them stable and easier for trace issue
  image:
    pullPolicy: IfNotPresent
    repository: percona/mongodb_exporter
    tag: "0.44.0"

  imagePullSecrets: []
Next, we will define the connection string of MongoDB to connect to them. For ensure the high-availability and same I told above, we will define this one using relicaSet instead of directConnection
  mongodb:
    uri: "mongodb://user:password@host1:port1,host2:port2,host3:port3/admin?replicaSet=namereplicaset"
Same as postgres, you need to create service-account for easier contribute RBAC if you want to improve security context
  serviceAccount:
    create: true
    # If create is true and name is not set, then a name is generated using the
    # fullname template.
    name: prometheus-mongodb-exporter
Next, you will enable servicemonitor to let your prometheus scrape this metrics
  serviceMonitor:
    enabled: true
    multiTarget:
      enabled: false
      # The username and password must be the same for every target configured below
      # The password is only added if the username is also set.
      username: ""
      password:
Lastly, because MongoDB Helm chart not support prometheusRule, therefore I try to define them by myself in templates folder
{{- if .Values.extra.mongodb.prometheusRule.enabled }}
apiVersion: monitoring.coreos.com/v1
kind: PrometheusRule
metadata:
  name: {{ .Release.Name }}-prometheus-mongodb-exporter
  namespace: {{ .Values.extra.mongodb.prometheusRule.namespace }}
  labels:
{{- with .Values.extra.mongodb.prometheusRule.additionalLabels }}
{{ toYaml . | indent 4 }}
{{- end }}
spec:
{{- with .Values.extra.mongodb.prometheusRule.rules }}
  groups:
    - name: prometheus-mongodb-exporter
      rules: {{ tpl (toYaml .) $ | nindent 8 }}
{{- end }}
{{- end }}
In values.yaml file, I try to add bunch value in extra part to support MongoDB create prometheusRule
# ExtraManifest for using with MongoDB and PostgreSQL
extra:
  mongodb:
    prometheusRule:
      enabled: true
      additionalLabels: {}
      namespace: "monitoring"
      rules:
      - alert: MongodbDown
        expr: 'mongodb_up == 0'
        for: 0m
        labels:
          severity: critical
        annotations:
          summary: "MongoDB Down (instance {{`{{ \"$labels.instance\" }}`}})"
          description: "MongoDB instance is down\n  VALUE = {{`{{ \"$value\" }}`}}\n  LABELS = {{`{{ \"$labels\" }}`}}"

      - alert: MongodbReplicaMemberUnhealthy
        expr: 'mongodb_rs_members_health == 0'
        for: 0m
        labels:
          severity: critical
        annotations:
          summary: "Mongodb replica member unhealthy (instance {{`{{ \"$labels.instance\" }}`}})"
          description: "MongoDB replica member is not healthy\n  VALUE = {{`{{ \"$value\" }}`}}\n  LABELS = {{`{{ \"$labels\" }}`}}"

      - alert: MongodbTooManyConnections
        expr: 'avg by(instance) (rate(mongodb_ss_connections{conn_type="current"}[1m])) / avg by(instance) (sum (mongodb_ss_connections) by (instance)) * 100 > 80'
        for: 2m
        labels:
          severity: warning
        annotations:
          summary: "MongoDB too many connections (instance {{`{{ \"$labels.instance\" }}`}})"
          description: "Too many connections (> 80%)\n  VALUE = {{`{{ \"$value\" }}`}}\n  LABELS = {{`{{ \"$labels\" }}`}}"

      - alert: MongoDbElectionOccurred
        expr: 'changes(mongodb_rs_members_electionDate[1m]) > 0'
        for: 0m
        labels:
          severity: warning
        annotations:
          summary: "MongoDB Election Occurred"
          description: "A replica set election just occurred on instance {{`{{ \"$labels.instance\" }}`}} in replica set {{`{{ \"$labels.rs_nm\" }}`}}. The new primary will be elected shortly."
Alright, you are able to setup MongoDB Exporter, but I will guide this one after we setup also OpenSearch (ElasticSearch) exporter
OpenSearch (ElasticSearch)
Lastly, I try to deloy also Prometheus ElasticSearch Exporter for expose metrics of opensearch and elasticsearch also, therefore I copy the original and start to modify this one
Before start, we need to define the value for ensure the condition equal true to let dependencies work with prometheus-elasticsearch-exporter
prometheus-elasticsearch-exporter:
  enabled: true
First of all, set the specific tag for exporter
  image:
    registry: ""
    repository: quay.io/prometheuscommunity/elasticsearch-exporter
    # if not set appVersion field from Chart.yaml is used
    tag: "v1.9.0"
    pullPolicy: IfNotPresent
    pullSecret: ""
Next, go to es part and update the uri of your opensearch (elasticsearch)
  es:
    ## Address (host and port) of the Elasticsearch node we should connect to.
    ## This could be a local node (localhost:9200, for instance), or the address
    ## of a remote Elasticsearch server. When basic auth is needed,
    ## specify as: <proto>://<user>:<password>@<host>:<port>. e.g., http://admin:pass@localhost:9200.
    ##
    uri: http://user:password@host:port
Alright, you should enable servicemonitor for prometheus scraping
  serviceMonitor:
    ## If true, a ServiceMonitor CRD is created for a prometheus operator
    ## https://github.com/coreos/prometheus-operator
    ##
    enabled: true
    apiVersion: "monitoring.coreos.com/v1"
Next, same as above database, we will also define the prometheusRule for this exporter
  prometheusRule:
    ## If true, a PrometheusRule CRD is created for a prometheus operator
    ## https://github.com/coreos/prometheus-operator
    ##
    ## The rules will be processed as Helm template, allowing to set variables in them.
    enabled: true
    namespace: ""
    labels: {}
    rules:
    - alert: ElasticsearchHeapUsageTooHigh
      expr: (elasticsearch_jvm_memory_used_bytes{area="heap"} / elasticsearch_jvm_memory_max_bytes{area="heap"}) * 100 > 90
      for: 2m
      labels:
        severity: critical
      annotations:
        summary: "Elasticsearch Heap Usage Too High (instance {{`{{ \"$labels.instance\" }}`}})"
        description: "The heap usage is over 90%\n  VALUE = {{`{{ \"$value\" }}`}}\n  LABELS = {{`{{ \"$labels\" }}`}}"

    - alert: ElasticsearchDiskOutOfSpace
      expr: elasticsearch_filesystem_data_available_bytes / elasticsearch_filesystem_data_size_bytes * 100 < 10
      for: 0m
      labels:
        severity: critical
      annotations:
        summary: "Elasticsearch disk out of space (instance {{`{{ \"$labels.instance\" }}`}})"
        description: "The disk usage is over 90%\n  VALUE = {{`{{ \"$value\" }}`}}\n  LABELS = {{`{{ \"$labels\" }}`}}"

    - alert: ElasticsearchClusterRed
      expr: elasticsearch_cluster_health_status{color="red"} == 1
      for: 0m
      labels:
        severity: critical
      annotations:
        summary: "Elasticsearch Cluster Red (instance {{`{{ \"$labels.instance\" }}`}})"
        description: "Elastic Cluster Red status\n  VALUE = {{`{{ \"$value\" }}`}}\n  LABELS = {{`{{ \"$labels\" }}`}}"
Lastly, we can’t forget to create serviceaccount for this exporter
  serviceAccount:
    create: true
    name: prometheus-elasticsearch-exporter
    automountServiceAccountToken: false
    annotations: {}
Deploy them all
Because my project use ArgoCD to deploy this deployment, but you can also use helm to handle instead of
First of all, same as deploy kube-prometheus-stack, you need update dependencies for your chart
helm dependency update ./After that, you just run install command to build the chart and deploy them into Kubernetes
helm install database-monitoring ./ -n monitoring -f values.yamlIf you want to update your helm value to another expectation, you can use upgrade command to handle this stuff
helm upgrade database-monitoring ./ -n monitoring -f values.yamlTo practice more with helm command and case-studies, you can double-check my Awesome Helm for more information, example and new idea.
Dashboard and Alert for ready to remediation
Note
Before we move on to my customized dashboards and alerts, I strongly recommend you double-check the following repositories to gather any necessary dashboards and alerts yourself. This is important because my version is subjective and may not cover all your specific operational needs.
- GitHub - Samber / Awesome Prometheus alerts
- GitHub - DrDroidLab / prometheus-alert-templates
- Grafana dashboards: Find the dashboard for your observability 🌟 (Recommended)
- GitHub - Percona / grafana-dashboards
Dashboards
Because I can share whole dashboard in this blog, you know grafana dashboard is a bit to insane about length, therefore I will redirect you to another page where keep my dashboard implementation, but from original, I base on these dashboard of multiple source via Grafana Page, such as
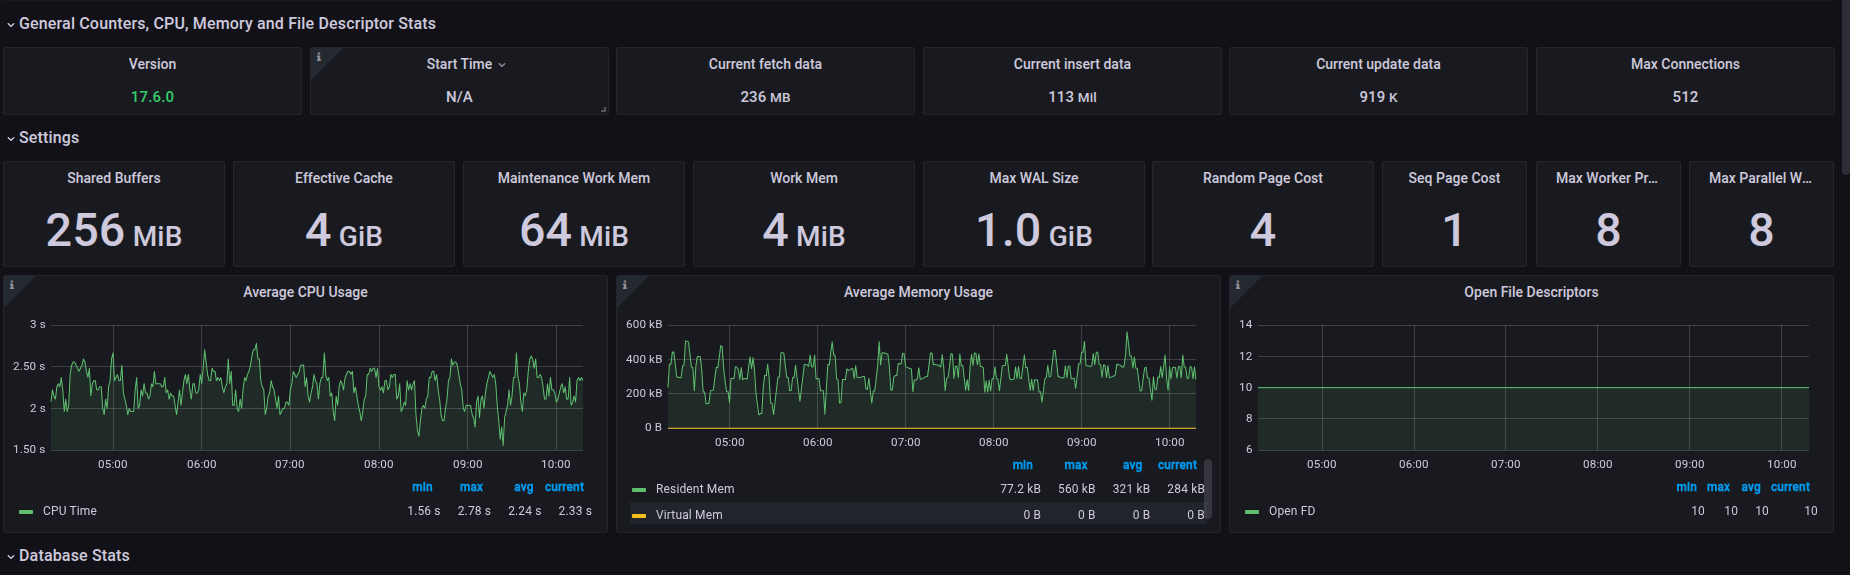
- PostgreSQL Database: Detail with useful information about PostgreSQL 🌟 (Recommended)
- Elasticsearch & OpenSearch: Providing a useful information for your elasticsearch & opensearch 🌟 (Recommended)
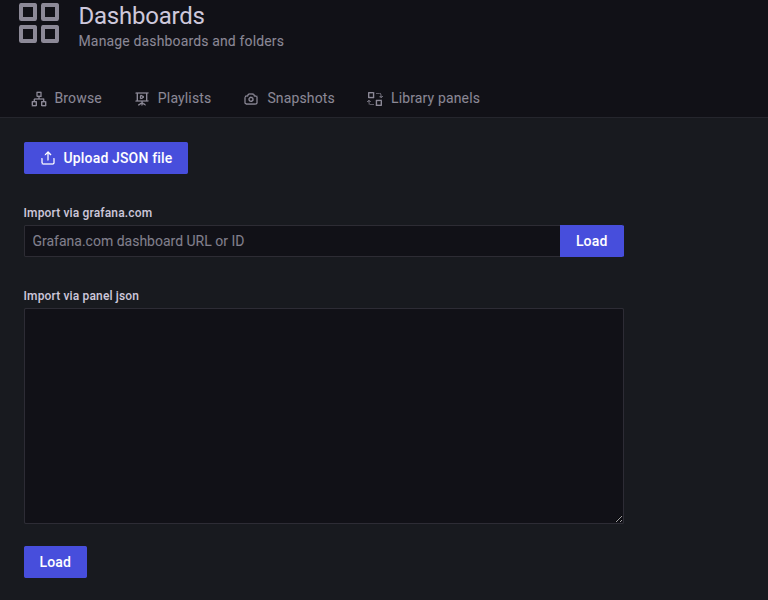
To import the dashboard, you can go to the Grafana via browser to access your self-hosted in Kubernetes, login and go to Dashboards > New > Import.
Now, you will have twice option to choose
- Upload JSON file dashboard
- Use URL or ID of dashboard from
grafana.com
With ElasticSearch & OpenSearch, I try to keep simple and not modify any of it, compare with version Elasticsearch & OpenSearch, there fore I will load the id of dashboard into my grafana and here i got
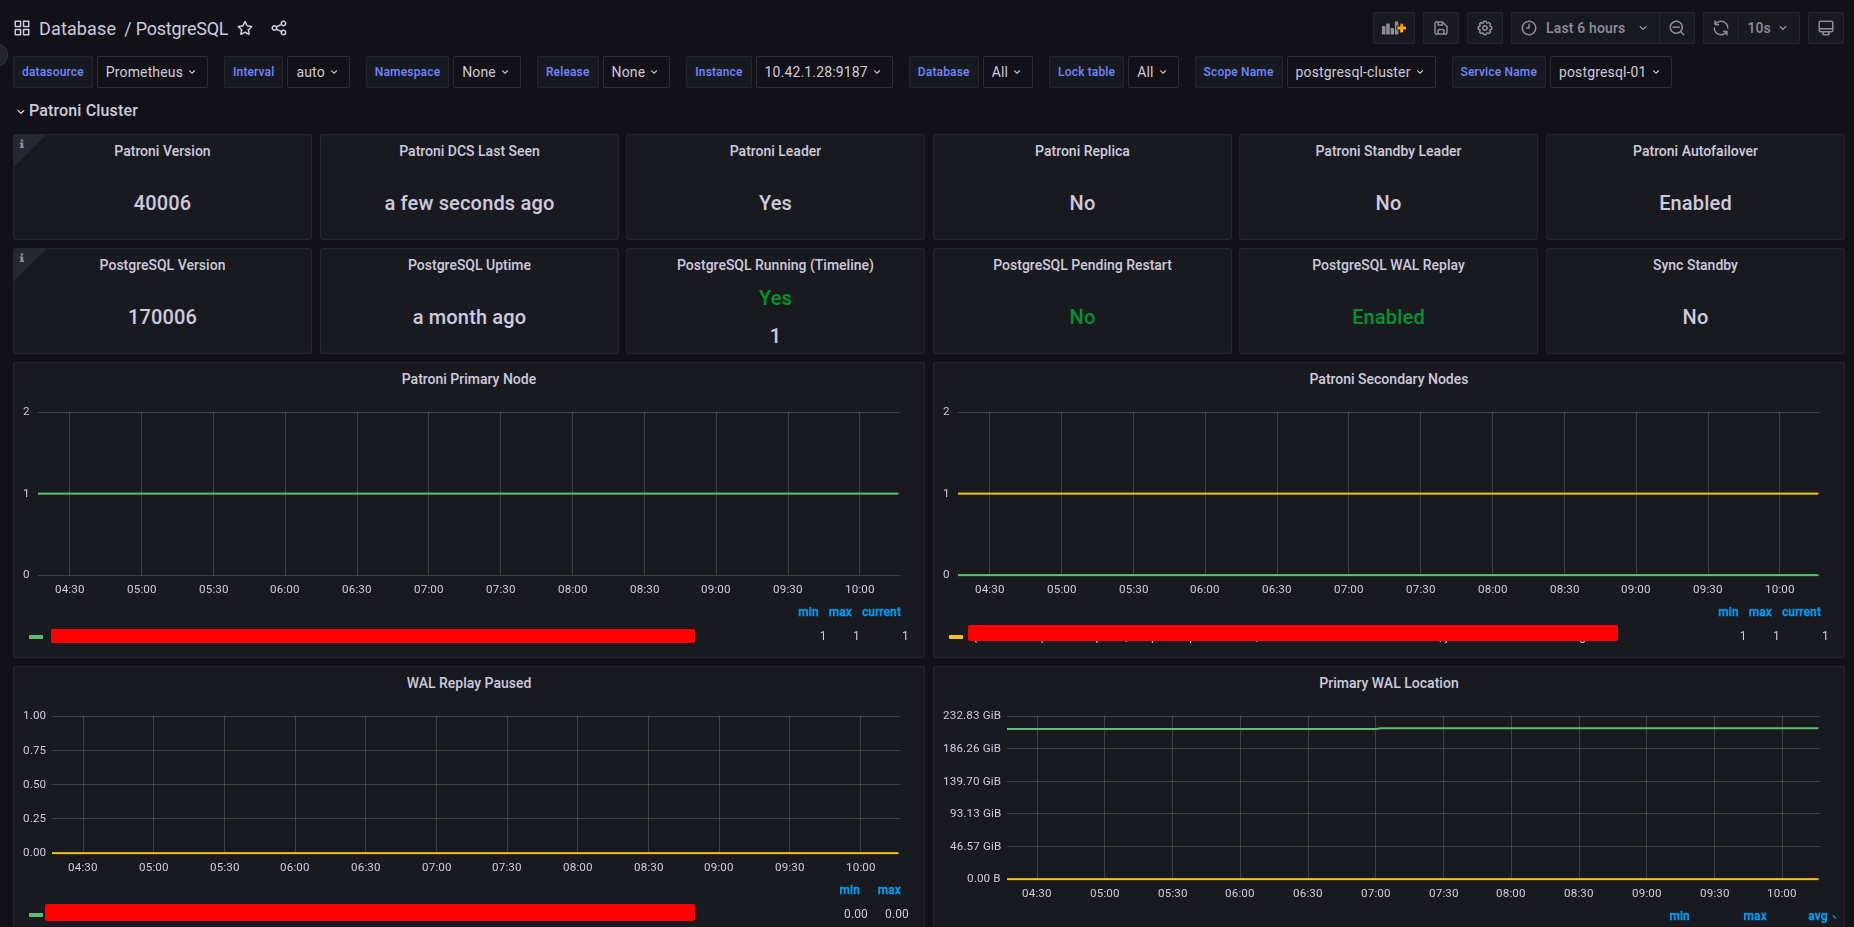
With PostgreSQL, I try also the PostgreSQL Database dashboard but, it customize it for the addition part of Patroni Cluster. Check more about fully json dashboard at PostgreSQL and Patroni Metrics Dashboard, you can easier import these dashboard in your Grafana
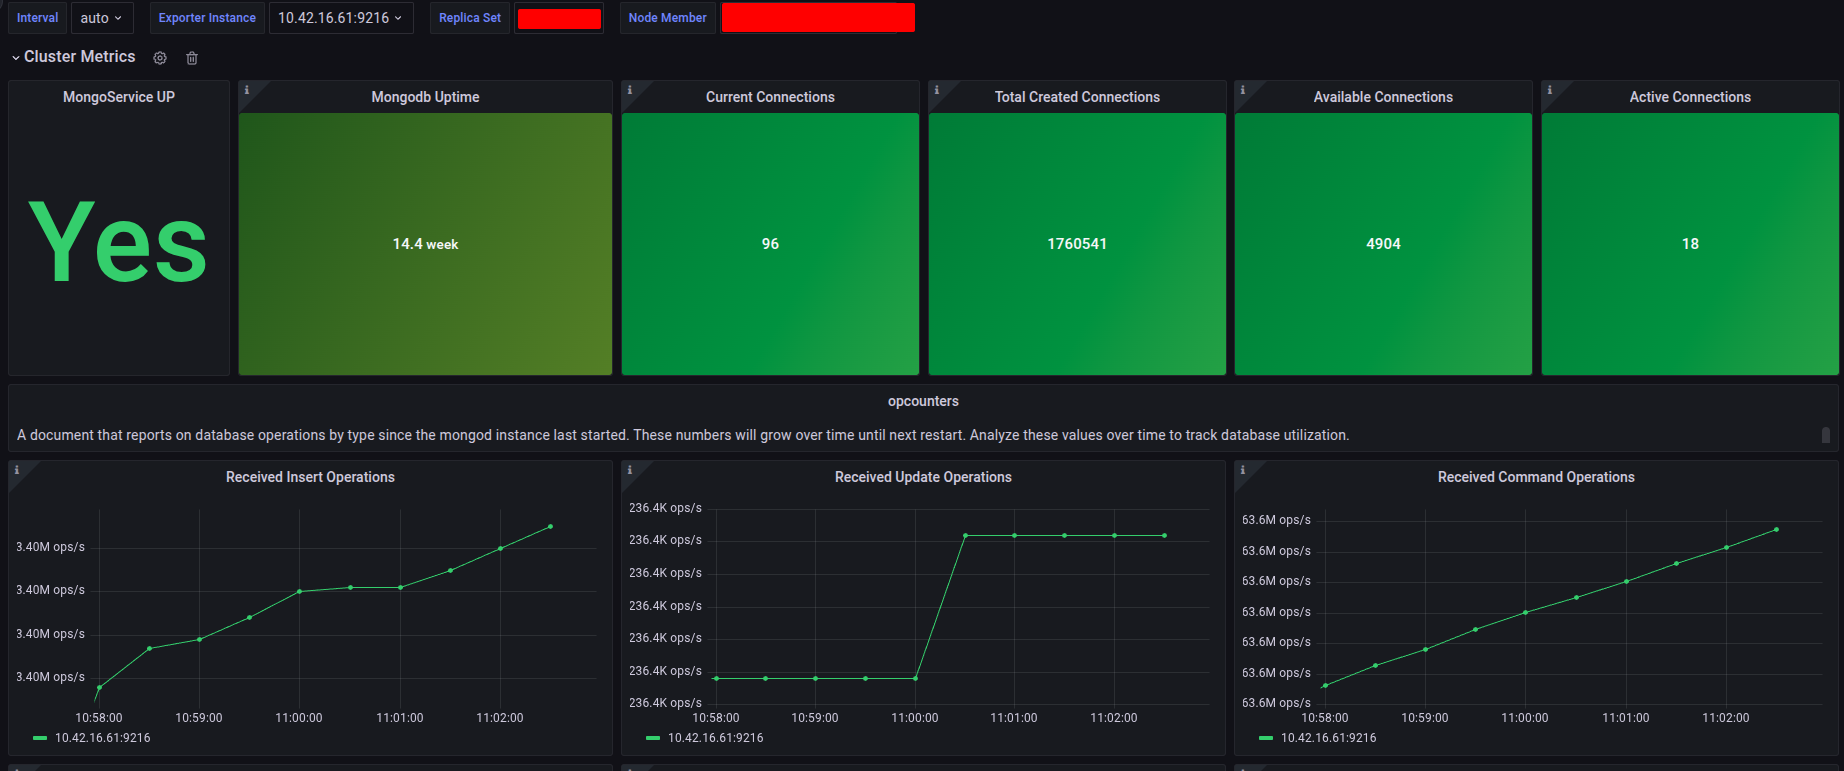
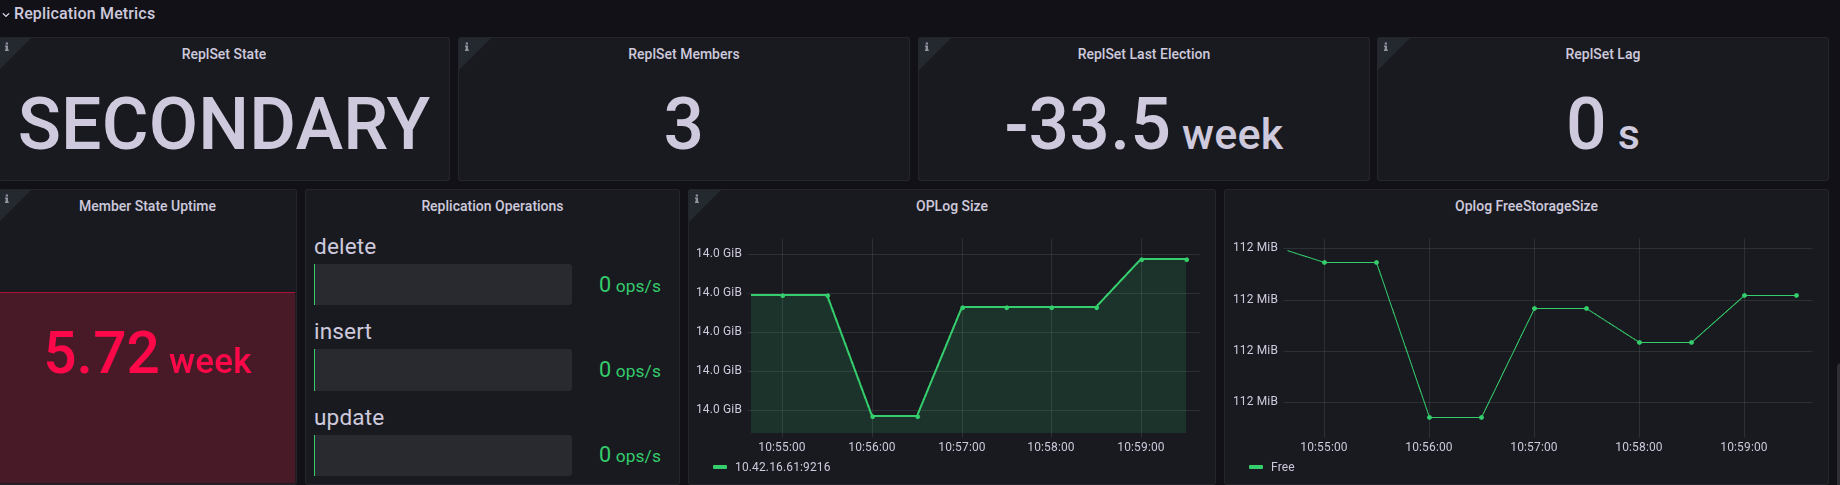
With MongoDB, I define it original and try to add also replicaset into dashboard, please check this one at MongoDB Metrics for Collection and ReplicaSet and import them if you want
Alerts
For alerting, you have already defined your rules as PrometheusRule resources within your Helm chart. Once you deploy this monitoring stack, these alerts will be automatically rendered and visible in the Alerts section of Grafana.
To ensure these alerts are actionable, you must configure at least one receiver for your notification channel (e.g., Slack, Email, PagerDuty) within Alertmanager.
For setting up Alertmanager receivers, you can refer to the following resources:
- Grafana - Step-by-step guide to setting up Prometheus Alertmanager with Slack, PagerDuty, and Gmail
- Medium - Configure Alert Manager with Slack Notifications on Kubernetes Cluster — Helm Kube-Prometheus Stack
Since the detailed configuration of Alertmanager falls under a separate topic, we will defer that for now. Assuming you have successfully completed the setup of both Alertmanager and your PrometheusRule resources, the following images illustrate the expected success state:

PostgreSQL Alert
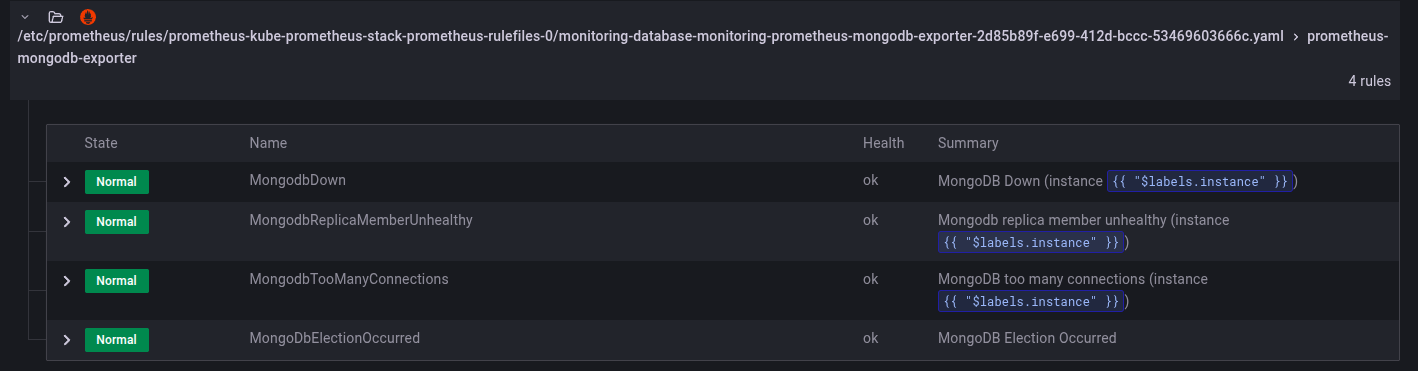
MongoDB Alert
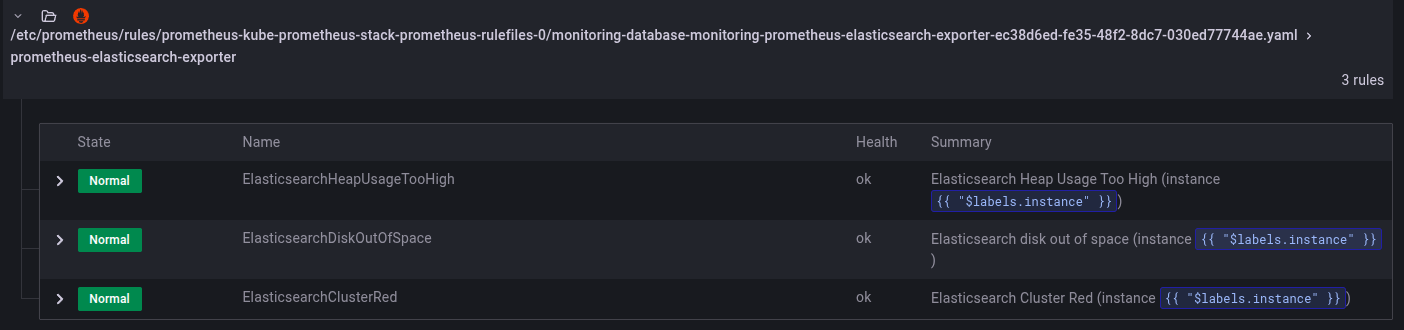
ElasticSearch (OpenSearch) Alert
Conclusion

Success
This concludes today’s article. I am genuinely enthusiastic about this topic and hope you found something valuable for yourself. When we discuss Monitoring and Observability, we are addressing a vast landscape. It is not an exaggeration to say that Site Reliability Engineering (SRE), while appearing straightforward, is incredibly difficult to execute perfectly. Therefore, continuously enhancing your knowledge, dedicating time to learn, and gaining value in this field is crucially important.
Quote
This blog post seems quite long and includes many techniques applicable to both newcomers and experienced users. I am still happy to publish it for those who wish to continuously immerse themselves in this area. I hope you are all well, maintain your health, stay persistent, and keep moving forward. I will see you soon in the next article. Bye and see you!
If you want to expand your research into monitoring and observability, I recommend checking out these blogs and articles. They will help you discover more advanced techniques, essential metrics, and specialized behaviors, allowing you to figure out a compatible tech stack for your specific circumstances.
- Proventa - Exporting metrics from etcd, PostgreSQL, PgBouncer & Patroni
- Cockroach Labs - High CPU usage in Postgres: how to detect it, and how to fix it
- YugabyteDB - Is My PostgreSQL Database Experiencing CPU, RAM, or I/O Pressure?
- JFrog - Troubleshooting High CPU Utilization in PostgreSQL Databases: A How-To Guide
- Sysdig - Top metrics in PostgreSQL monitoring with Prometheus