Quote
A fundamental skill in web security is the manual review of an application to identify vulnerabilities. This involves analyzing the page source, utilizing browser developer tools to inspect elements, debugging scripts, and monitoring network traffic.
Walking an Application (Methods)
Below is a breakdown of the built-in browser tools essential for performing a manual security review:
- View Source: Allows you to examine the human-readable source code transmitted by the server.
- Inspector: Used to analyze specific DOM elements, modify styles/attributes in real-time, and uncover hidden or restricted content.
- Debugger: Provides the ability to set breakpoints, inspect variables, and control the execution flow of the page’s JavaScript.
- Network: Displays all outgoing and incoming network requests, allowing you to analyze headers, payloads, and API calls.
Exploring the Website
- In this phase, you must identify interactive features that could serve as potential attack vectors. The goal is to test these features to assess whether they can be exploited to bypass security controls.
- Identifying interaction points ranges from obvious elements like login forms to more subtle logic found by manually auditing the application’s JavaScript files and API endpoints.
View Page Source Skills
- The Page Source is the raw, human-readable code delivered from the web server to the client.
- This code typically consists of HTML, CSS, and client-side JavaScript. Reviewing the source can reveal sensitive information such as developer comments, hidden hidden input fields, or paths to internal API endpoints.
There are two common methods to access the source:
- Browser URI Scheme: Use the
view-source:prefix in the address bar (e.g.,view-source:https://www.google.com). - Developer Tools: Use the
F12shortcut or right-click anywhere on the page and select “Inspect” or “View Page Source”.
Tip
While viewing the code is the first step toward understanding an application’s architecture, a solid grasp of HTML/JavaScript is required to identify misconfigurations or logic flaws hidden within the tags and scripts.
Developer Tools - Inspector
- Developer Tools: Every modern browser includes a built-in suite of Developer Tools. This toolkit is designed to assist web developers in debugging applications by providing a transparent look at the underlying mechanics of a website. As a pentester, we specifically focus on three core features: the Inspector, the Debugger, and the Network tab.
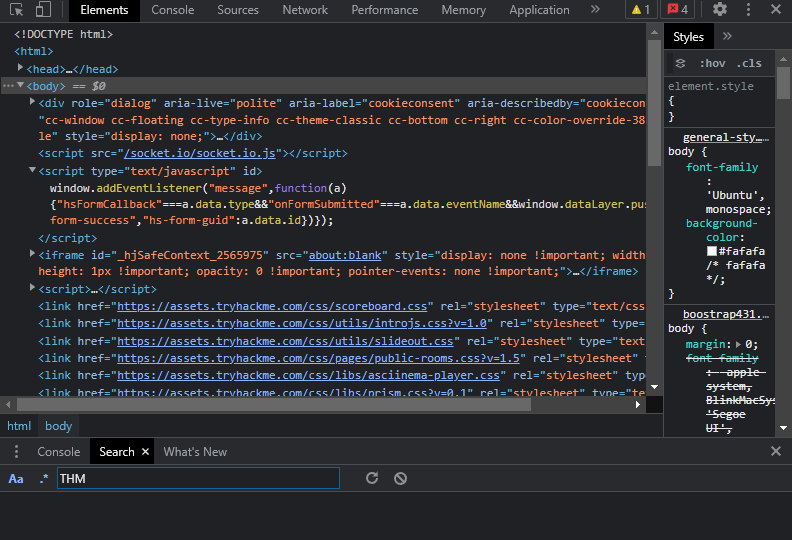
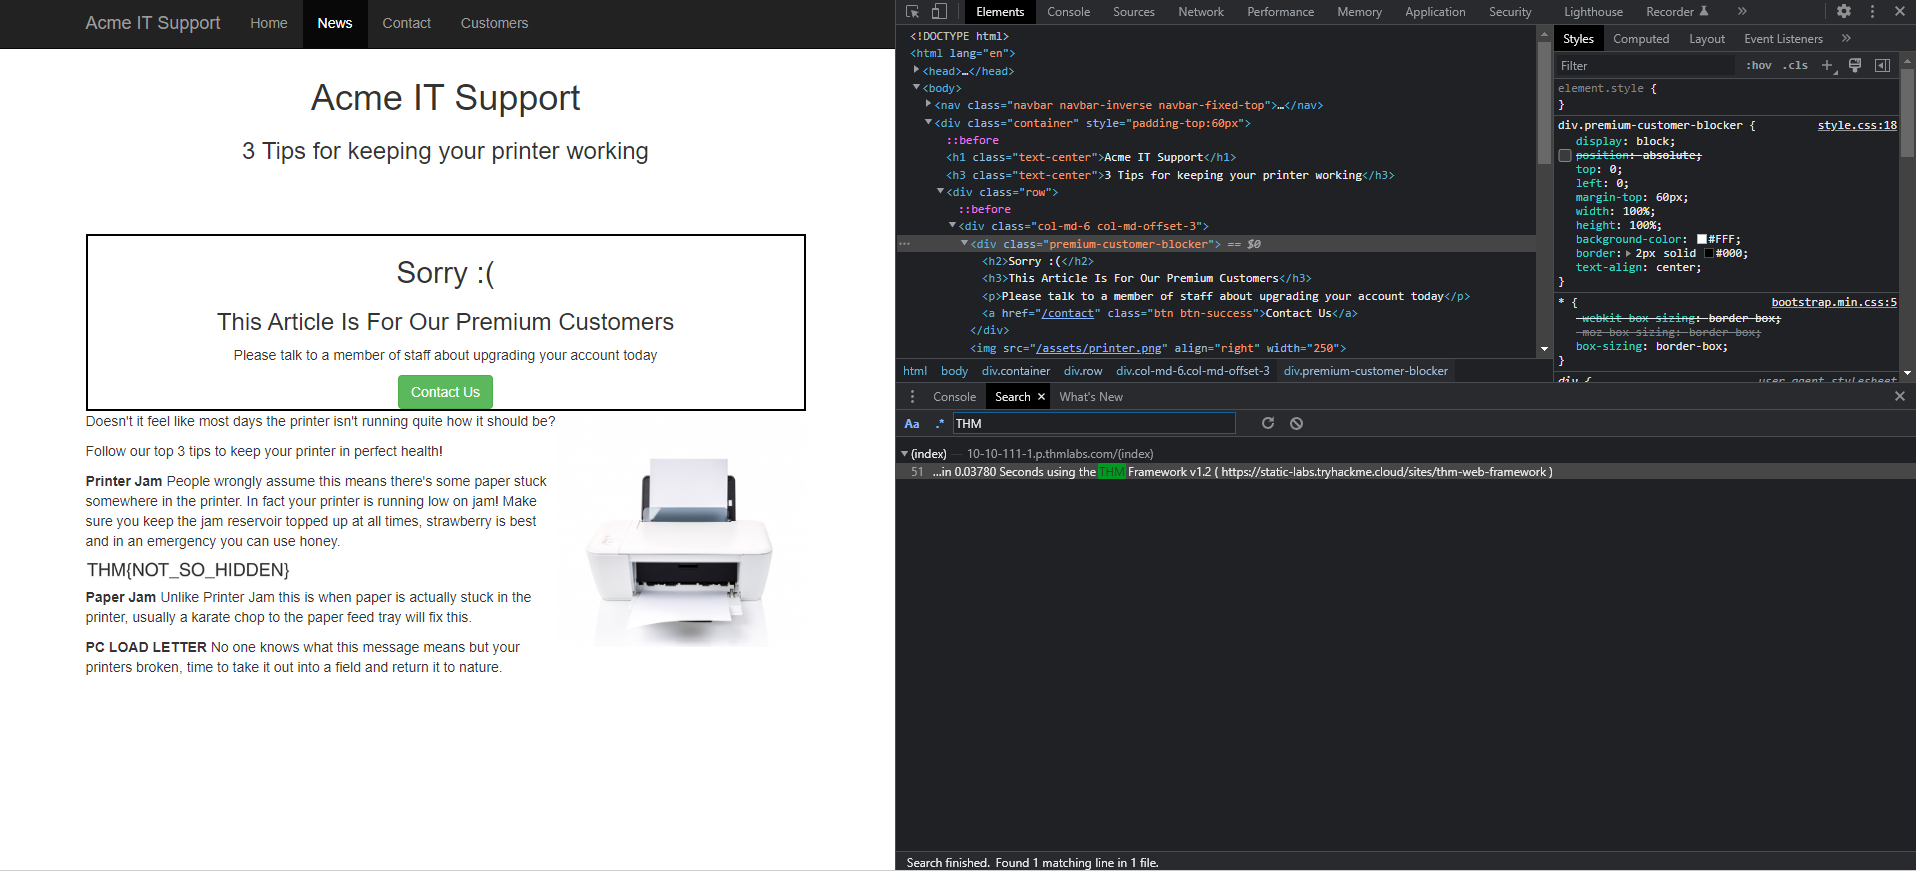
- The Inspector: The static page source code does not always reflect the current state of a web application; dynamic content generated by CSS, JavaScript, and user interactions can alter the DOM (Document Object Model) in real-time. The Element Inspector provides a live representation of the current browser state, allowing us to see exactly what is being rendered at any given moment.
- Dynamic Interaction: Beyond observation, the Inspector allows us to edit and interact with page elements on the fly. This capability is essential for developers debugging UI issues and for security researchers testing for client-side vulnerabilities like DOM-based XSS or CSS manipulation.
Developer Tools - Debugger
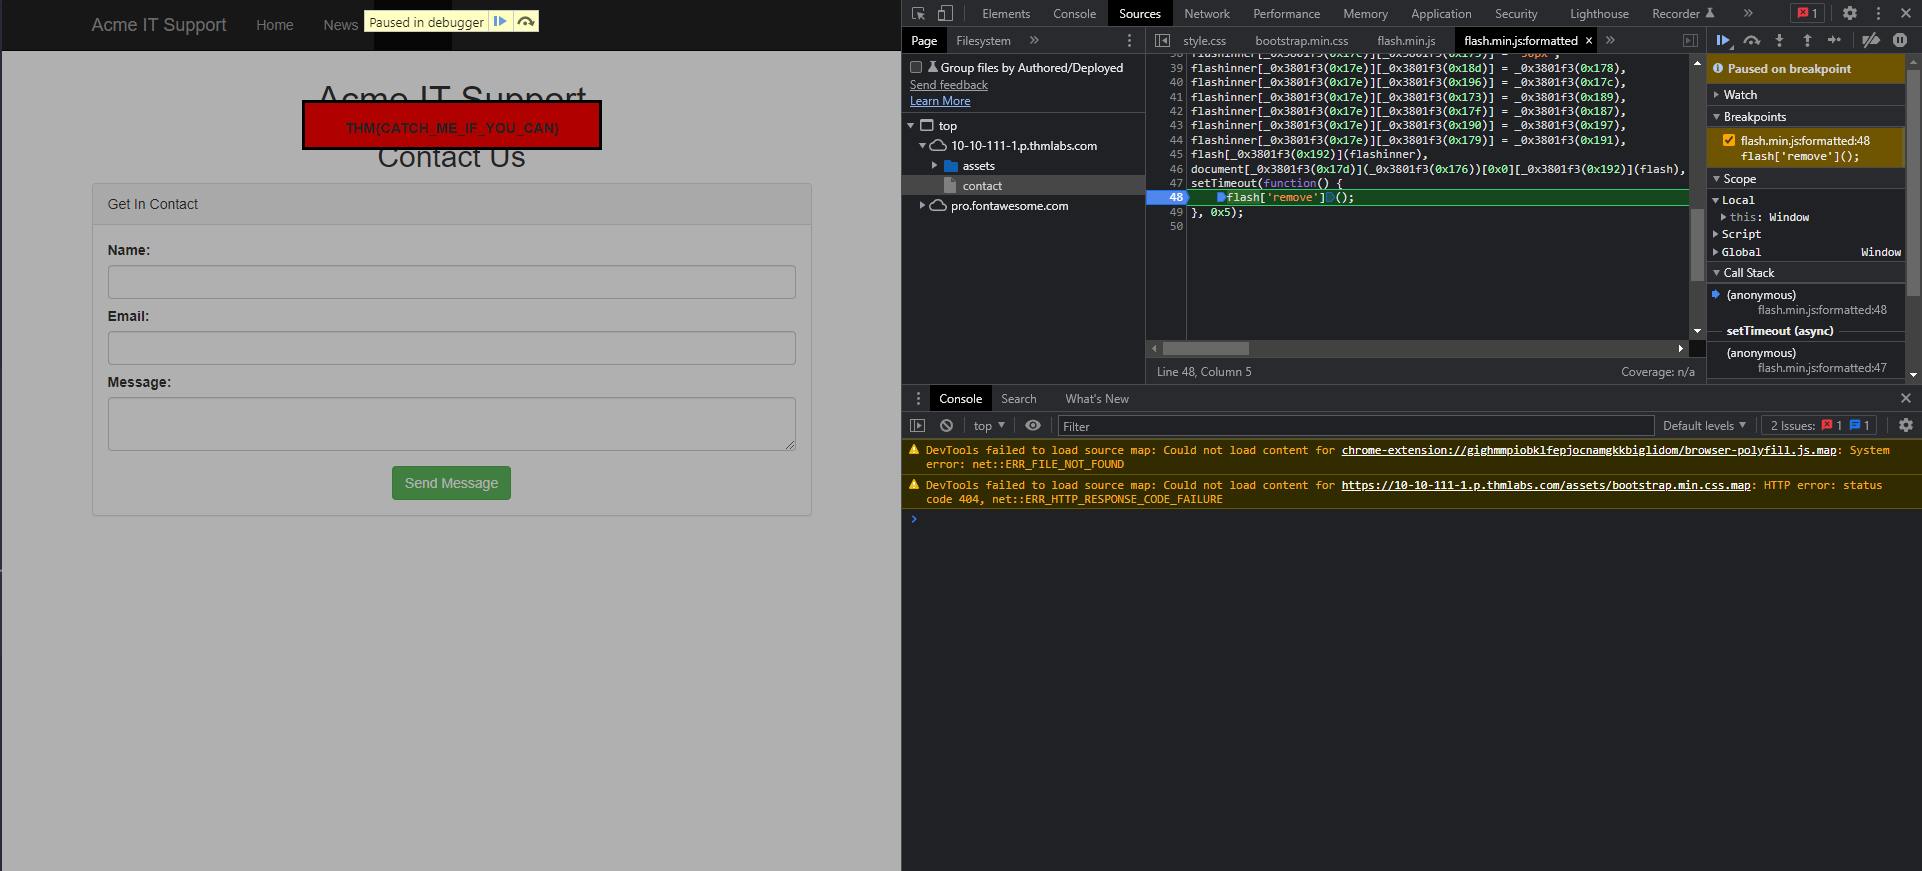
The Debugger panel in the browser’s developer tools is specifically designed for debugging JavaScript. While it is an essential feature for developers troubleshooting code logic, for penetration testers, it provides a powerful environment to perform deep analysis of client-side scripts. By using the Debugger, you can set breakpoints, step through execution flow, and inspect the state of variables to uncover hidden logic or security flaws.
Developer Tools - Network
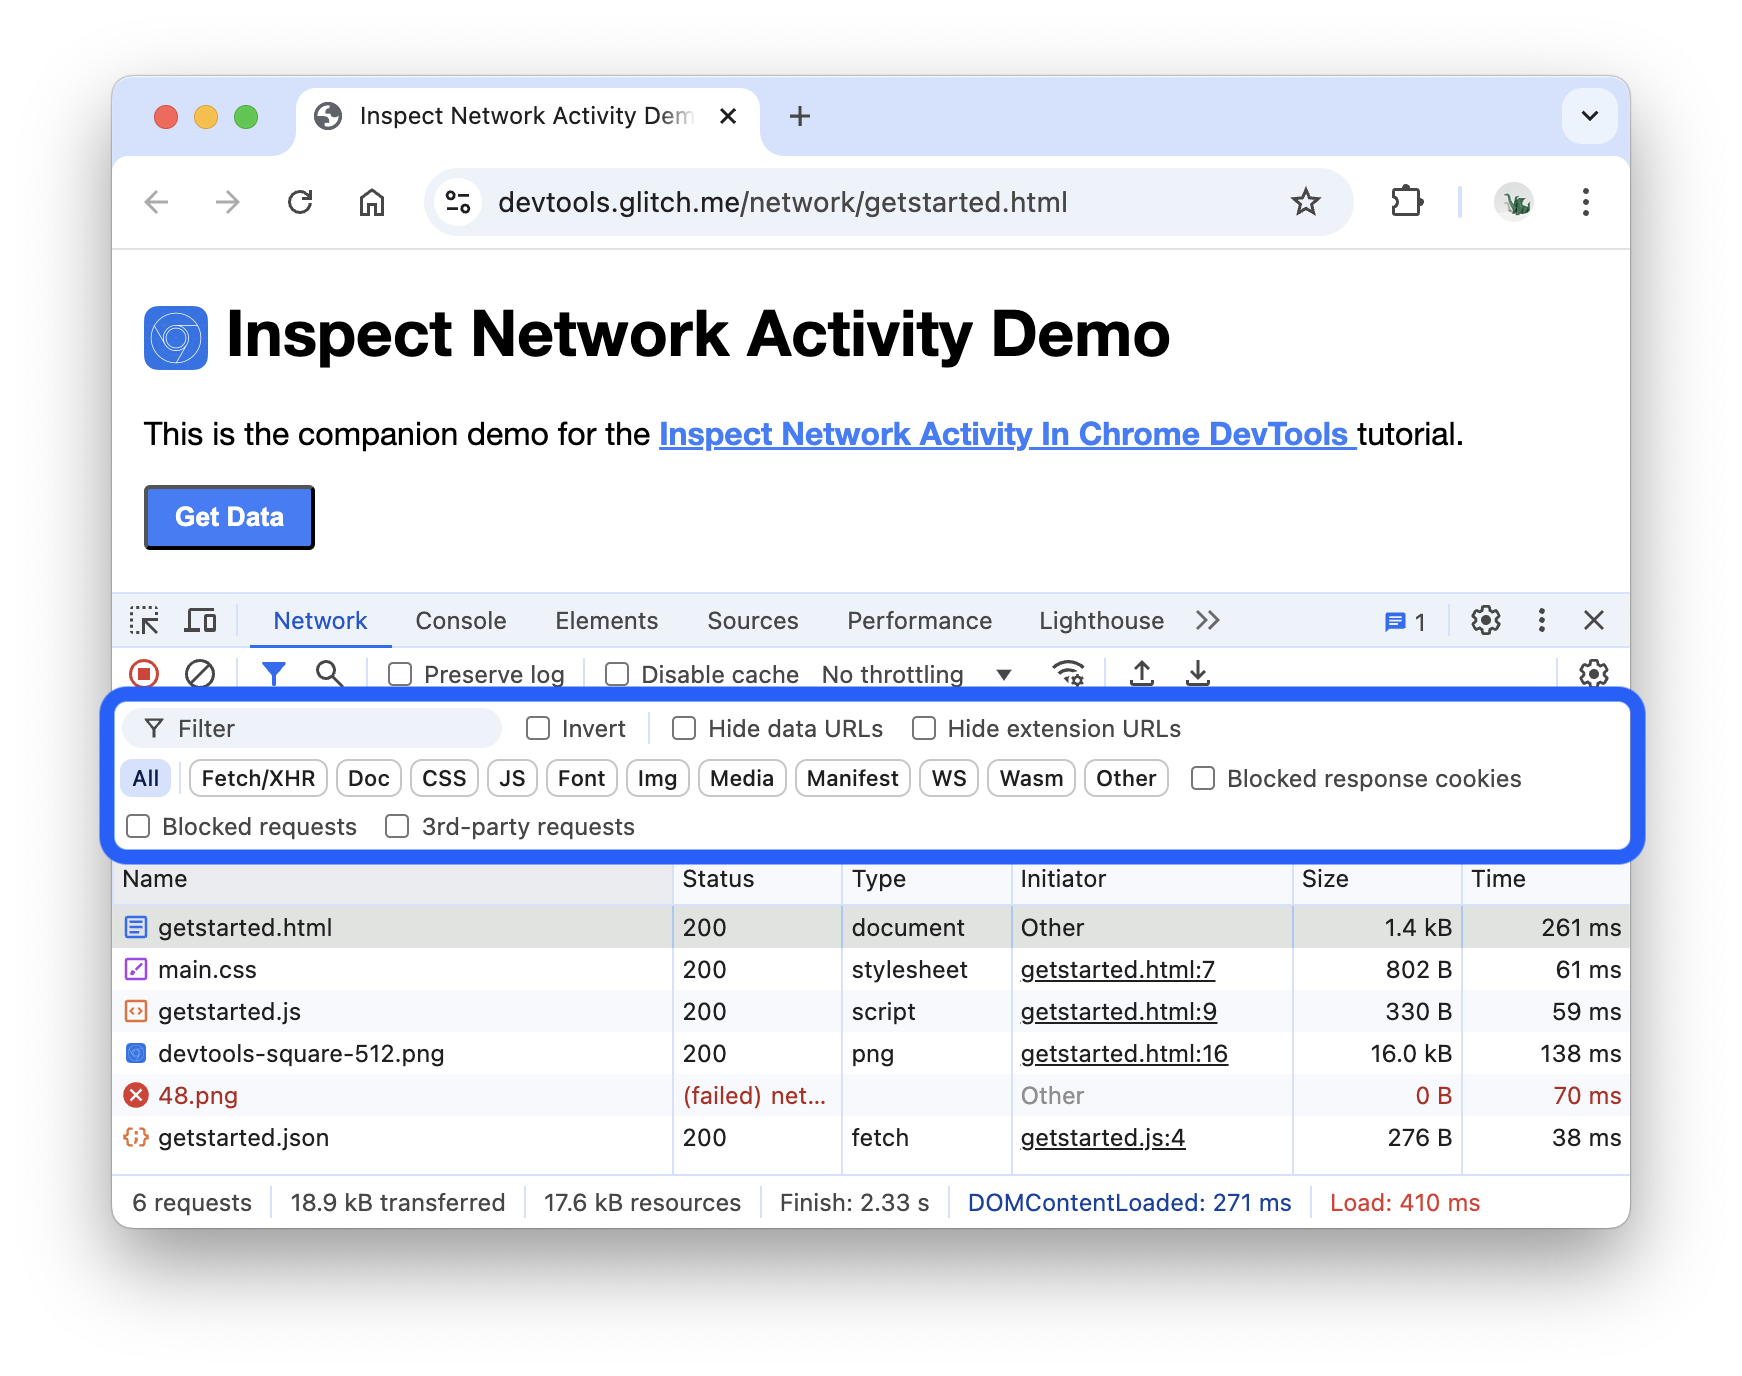
The Network tab in the developer tools is used to monitor every external request a webpage initiates. By navigating to the Network tab and refreshing the page, you can capture a real-time log of all resources the browser requests, including scripts, images, and API calls.
- Request Tracking: Observe the waterfall of requests to see the load order and duration of each asset.
- Payload Inspection: Click on individual requests to inspect headers, cookies, and the raw data sent in the request or received in the response.
- Troubleshooting: Identify failed requests (e.g., 404 or 500 errors) and analyze slow-loading resources that impact performance.