Hi everyone! It’s been a few weeks since my last post. To be honest, I’ve been deeply focused on building the MVP for W’xOps. It’s quite a journey, and I’ll be sure to recap that story soon. I’ve spent a lot of time learning and practicing lately, and I finally feel ready to share some of that work with you—concepts that will soon be integrated directly into W’xOps.
Today, Kubewekend is back! We are wrapping up our major series on Full-Stack Monitoring and Observability, specifically focusing on the LGTM stack (Loki, Grafana, Tempo, Mimir) and Continuous Profiling with Grafana Pyroscope.
I believe this session will be incredibly useful for anyone who loves Grafana and Prometheus. We’ll explore an ecosystem capable of building advanced SRE workflows, on-call systems, and plugins that span across entire multi-cloud and multi-cluster environments.
Without further ado, let’s take a deep dive into the stack!
The Kubewekend and Monitoring Stack Now
After a time developement, honestly to say, Kubewekend becomes more and more enormous today, I would say that one of creatures I proud too much, instead of that’s not popular much. But believe if I have enough lucky, Kubewekend will be adopted by many fork out there, it’s a future story. If you want to discover it as well, let’s drop the 🌟 for this repository at GitHub - Kubewekend
About Kubewekend
Kubewekend is a comprehensive learning repository designed for practicing and self-hosting Kubernetes and its surrounding ecosystem.
It serves as an “all-in-one” toolkit covering essential domains such as Ingress, Gateway API, Authentication, GitOps, Monitoring, and Identity Management. Currently, Kubewekend facilitates seamless self-hosting on remote VMs or VPS instances using automation tools like Ansible and Vagrant.
The platform currently supports two major Kubernetes distributions: K3s and Kind. Both are configured to support the latest Kubernetes APIs and features, ensuring your environment stays current with industry standards. While managed services like AKS or EKS have their place, Kubewekend is built for those who want to set up a fully functional cluster more affordably—often for just a few dollars on a standard VPS.
Because the platform is built by and for Cloud Native enthusiasts, it is highly customizable. You can easily modify configurations to align with your specific tech stack. Whether you are building a lab for deep technical research or simply want to experiment with the latest CNCF projects, Kubewekend provides the flexible foundation needed to adapt and learn at your own pace.
About Monitoring and Observability nowadays
Returning to today’s core topic - the Monitoring and Observability landscape. Specifically within the Cloud Native ecosystem, this field is incredibly vast. With a staggering number of options available, it is virtually impossible to master every single tool.
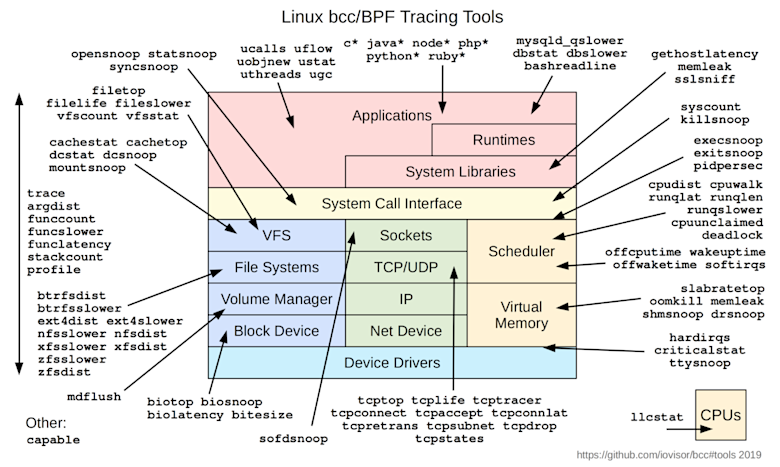
Based on my experience, the key to success is focusing on the underlying techniques and architectural patterns rather than the individual tools. Every modern stack is built upon core concepts—such as telemetry collection, data cardinality, and distributed tracing—and you must master these fundamentals before you can truly control any specific observability platform. Explore more at couple of repositories and articles below for general landscape
As we look back over the past decade, monitoring and observability have evolved significantly, reaching a new level of sophistication by 2026. It is no longer just about viewing isolated metrics and logs; the field has become a complex discipline where the data produced is critical for understanding internal system behavior. By analyzing logs and metrics in tandem, we can detect underlying issues far more effectively.
This progress is driven by powerful frameworks like OpenTelemetry and eBPF, which allow us to dive deep into the system’s architecture and surface granular insights. Furthermore, the integration of AI-driven agents has become a game-changer; these agents assist by reading, understanding, and suggesting strategic ways to approach system management. This evolution has solidified observability as an indispensable part of the modern software development lifecycle.
With my experience and my workspace,I can suggest several tools below for your setup, including
ELK
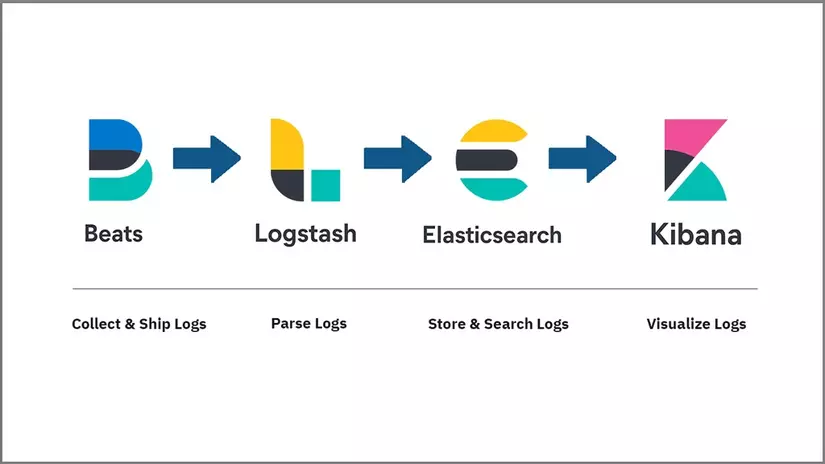
The ELK is one of popular stacks, and fairly to say that one will be loved by many developers, especially in my country. This one is the combination from four main components, including
Beats: lightweight, single-purpose data shippers that can send data from hundreds or thousands of machines to either Logstash or Elasticsearch.
Logstash: the data processing component of the Elastic Stack which sends incoming data to Elasticsearch.
Elasticsearch: a distributed REST search engine which stores all of the collected data.
Kibana: a web interface for searching and visualizing logs.
The ELK stack offers significant flexibility regarding log collection. Before the introduction of the Elastic Agent, I relied heavily on other collectors, specifically Fluentd and Fluent Bit. Revisiting these tools in 2026, I’ve found that they have evolved far beyond simple log shipping. They are now fully capable of managing the entire telemetry stack—handling logs, metrics, and traces with high efficiency—making them powerful alternatives for building comprehensive observability systems.
While the ELK Stack (Elasticsearch, Logstash, Kibana) was traditionally viewed primarily as a log collection and analysis tool, the emergence of eBPF and the OpenTelemetry (OTel) framework has fundamentally changed this narrative. ELK has evolved into a comprehensive observability platform. By leveraging the unified Elastic Agent, organizations can now collect logs, metrics, traces, and profiling data through a single agent. This modernization allows ELK to provide deep insights across the entire stack, shifting it from a specialized logging tool to a robust, full-stack observability solution.
The industry is seeing a significant shift as the ELK Stack adopts an architecture similar to the Grafana (LGTM) stack. For enterprise monitoring, adapting the modern ELK stack allows you to centralize all telemetry data in one place. This consolidation simplifies management and transforms raw data collection into actionable business value.
From my perspective—and this is a subjective view—if you choose the ELK Stack, you must be prepared to allocate significant resources for self-hosting, particularly for Elasticsearch. Since these tools are largely built on Java, mastering JVM configuration and Heap memory management is essential to ensure the stack remains stable and performant under your specific workloads.
While I appreciate the power of ELK, it would not be my first choice for a production setup due to these resource requirements. However, for experimentation and learning, I highly recommend trying ELK at least once. It is very accessible, features exceptionally detailed documentation, and is compatible with almost any modern infrastructure, whether you are running on a VPS, Docker, or Kubernetes.
You can explore about ELK via these resources below for your setup
Regarding the Kubewekend roadmap: due to time constraints and my focus on building a personalized “love stack” for my own products, the integration of ELK has been temporarily put on hold. However, I still plan to incorporate it into Kubewekend in the future to provide a robust environment for those who want to experiment with more traditional enterprise monitoring.
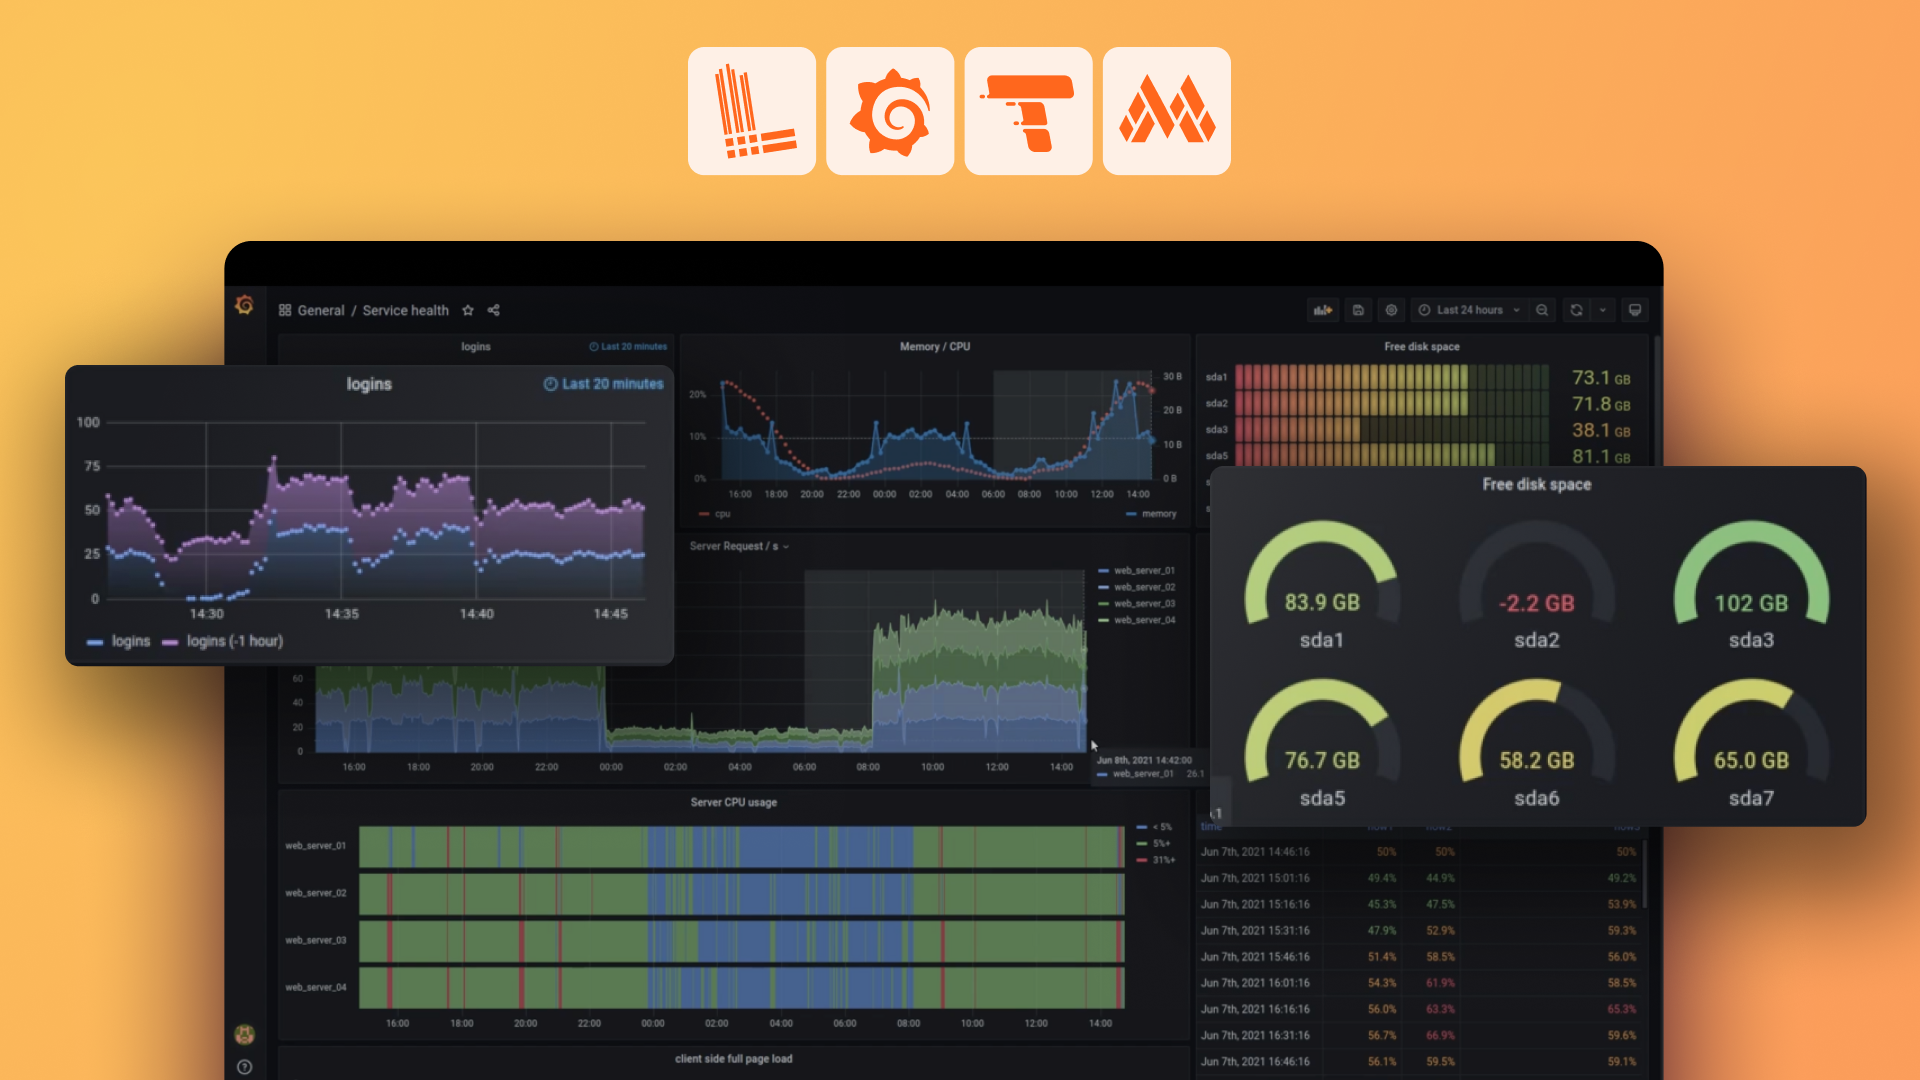
LGTM
I consider the Grafana ecosystem—specifically the LGTM stack—to be my primary choice when architecting a monitoring solution. I have invested significant effort into mastering these tools, spanning from initial configuration and the deployment of collectors and exporters to the design of sophisticated dashboards and alerting systems.
I prefer the Open-Source (OSS) versions over enterprise offerings such as AWS Managed Services or Grafana Cloud. While I have experience with cloud-managed solutions, I find the flexibility and depth of the OSS stack to be superior for exploration. Although configuring these components can present a steep learning curve for beginners, the resulting observability is incredibly robust.
The Grafana LGTM stack provides a comprehensive methodology for monitoring applications, containers, nodes, and diverse infrastructure platforms. By leveraging OpenTelemetry to unify metrics, logs, and traces—and integrating eBPF for continuous profiling—it offers a complete observability suite. Below is a high-level walkthrough of the key tools within this ecosystem:
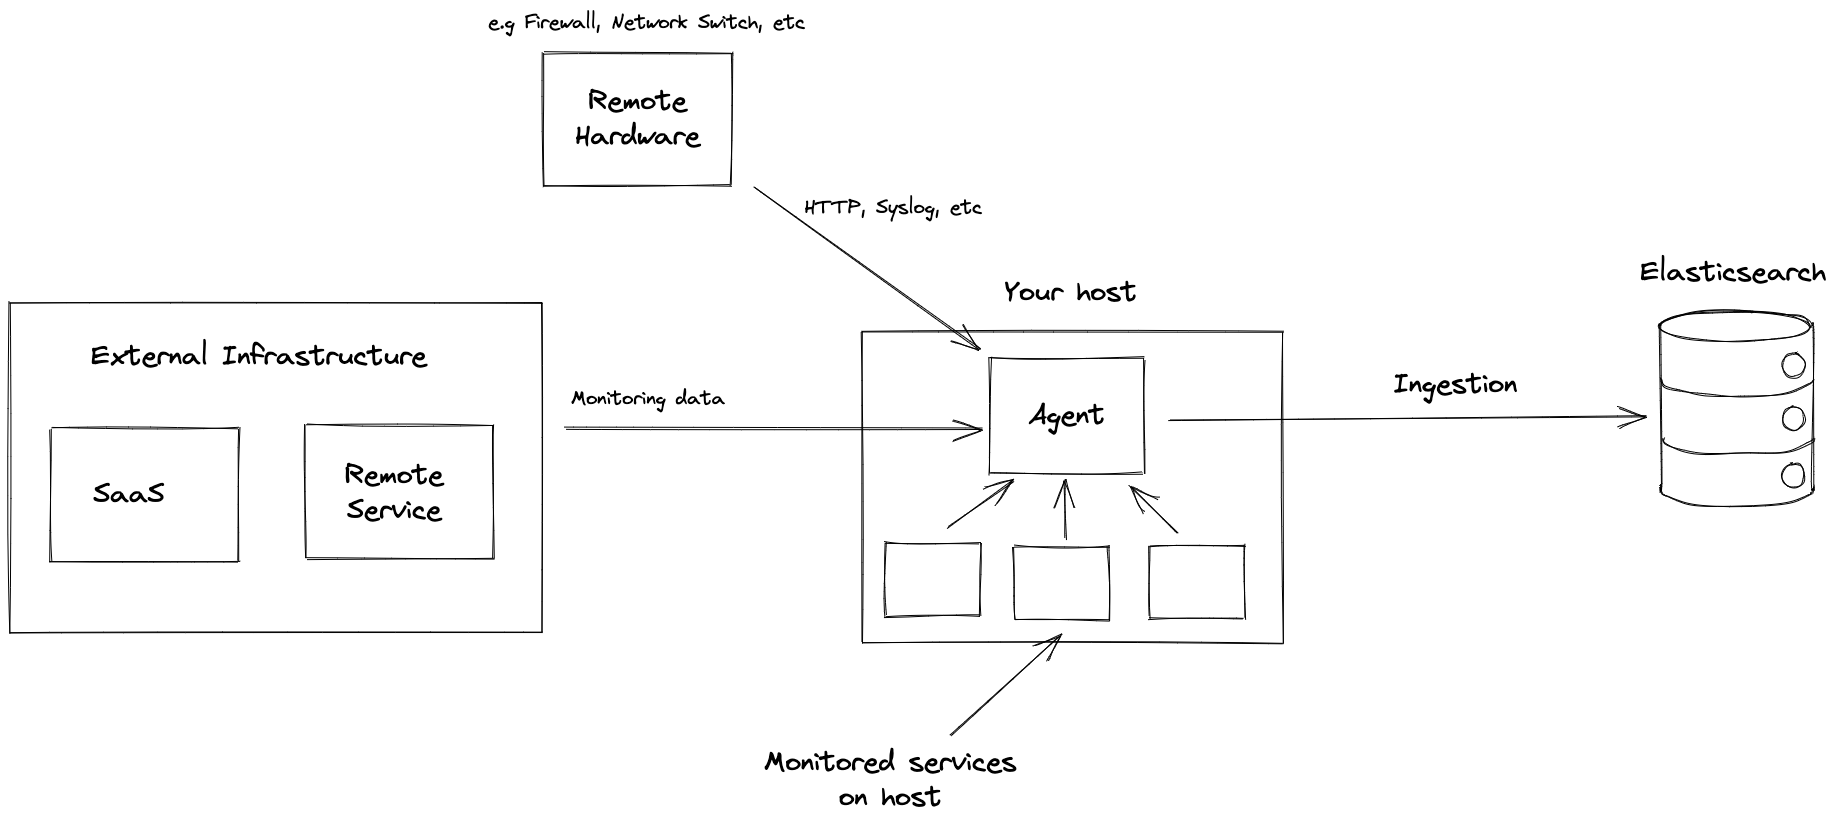
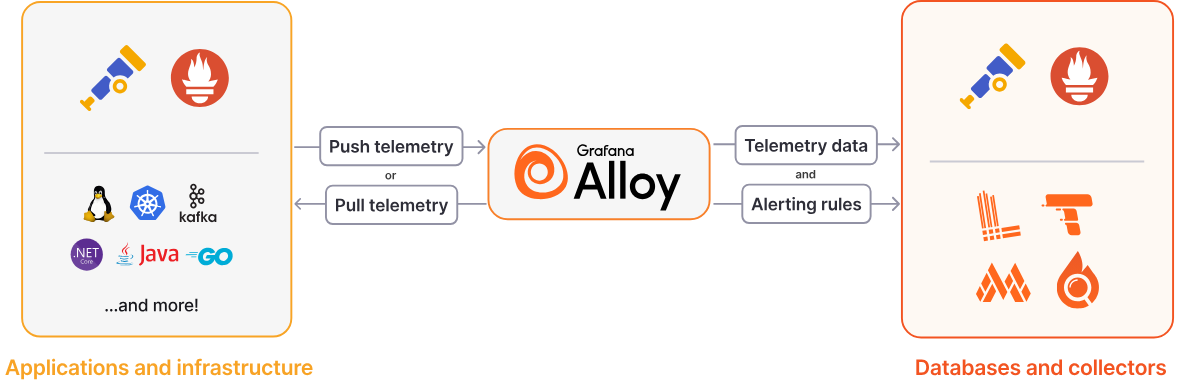
Regarding Agents, Grafana provides several options for collecting monitoring data from external resources, including Grafana Alloy and the now-deprecated Grafana Agent. Within the modern ecosystem, Grafana now favors a unified approach where a single agent—Alloy—collects all telemetry data. This simplifies the architecture by creating a cohesive link between various data sources and databases. While mastering this integration can be challenging, it is a deeply rewarding area for those looking to delve into advanced observability.
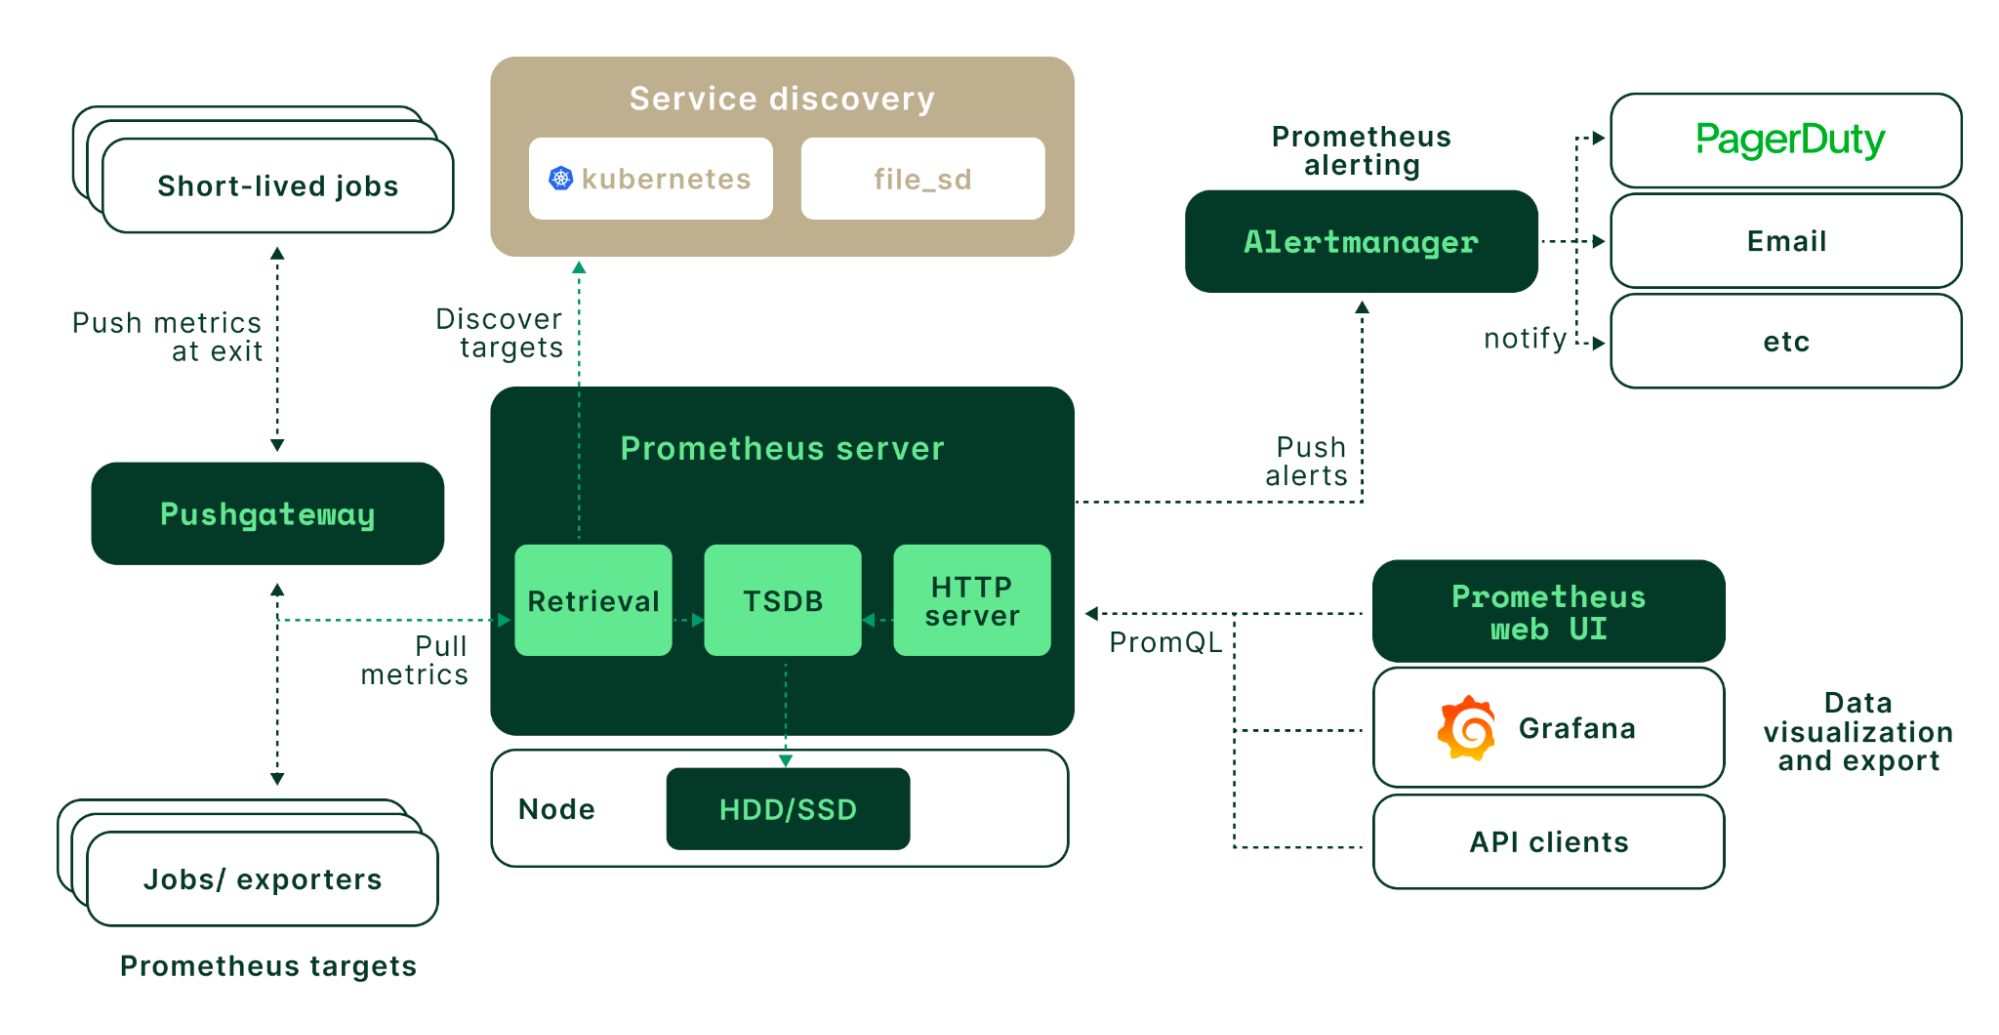
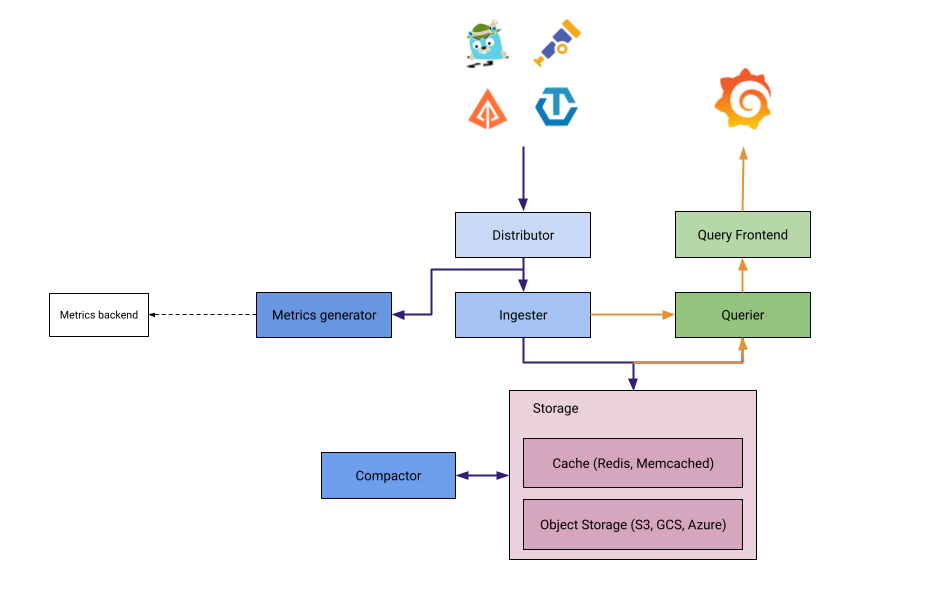
In the realm of Metrics, Prometheus is the industry-standard TSDB for storing data from various external exporters, such as cAdvisor and Node Exporter. To enhance scalability and high availability for long-term storage, the CNCF ecosystem utilizes Thanos. Furthermore, Grafana offers Grafana Mimir, a solution specifically engineered for high-performance metrics collection in distributed architectures.
For Logging, Grafana Loki serves as the primary log aggregation database, allowing you to parse, store, and query logs using LogQL. While the modern stack leverages Grafana Alloy for telemetry collection, Loki maintains compatibility with various legacy collectors such as Fluentd, Fluent-bit, Promtail, and even Logstash. Loki remains one of the most efficient and accessible log management solutions within the Grafana ecosystem.
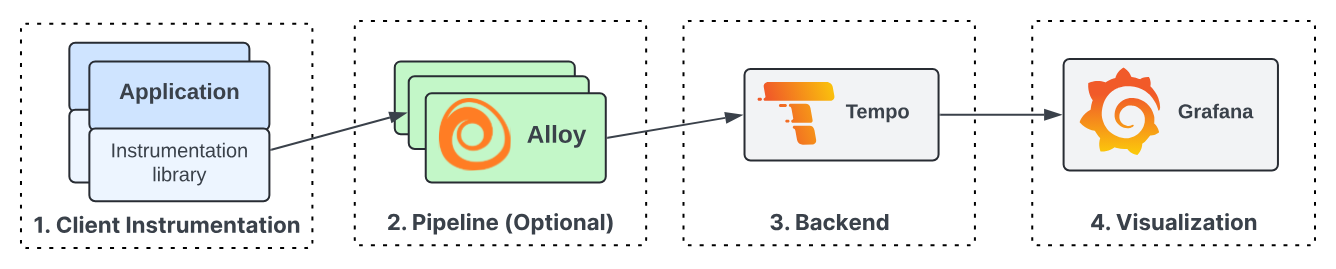
For Tracing, Grafana Tempo is used to store traces, search through spans, and generate metrics. Tempo acts as a central component that links other observability pillars together. When combined with OpenTelemetry and Grafana Alloy, Tempo enables the creation of a powerful Application Performance Monitoring (APM) system. You can explore more in this comparison of Open-Source Tracing Tools: Jaeger vs. Zipkin vs. Grafana Tempo.
With the emergence of eBPF, Grafana Pyroscope provides deep-level application Profiling, reaching down to the kernel to help identify performance bottlenecks. Additionally, Grafana Beyla offers eBPF-based auto-instrumentation, allowing users to jumpstart application observability by inspecting the OS networking layer and capturing trace spans for web transactions without manual code changes.
For Alerting and On-Call Management, the stack includes Alertmanager, Grafana Alerting, the deprecated Grafana OnCall, and Grafana IRM. These tools are designed for high-availability environments with strict operational rules. Grafana facilitates a seamless connection between these components, creating a comprehensive “all-in-one” workflow from initial data ingestion to final incident notification.
You can explore more about setup via articles and repositories below
As demonstrated, the comprehensive Grafana ecosystem makes observability truly engaging and equips engineers to tackle complex challenges effectively. It creates an environment that sparks innovation by seamlessly correlating dashboards with metrics, logs, traces, and profiling, providing deep visibility into application internals. To achieve this, I have successfully integrated these capabilities into the Kubewekend monitoring stack, and I will share the technical details in the next part of this blog series.
Others
What about other options? Are there alternatives? The answer is a resounding yes, and there are many. I believe that monitoring and observability are no longer solely the responsibility of DevOps or SRE teams. Modern platforms now leverage AI-driven analysis and summarization to derive actionable value from data. Consequently, there are numerous technology stacks available—ranging from open-source to enterprise—tailored to meet the specific requirements of different business use cases.
You can find to alternative stack, including
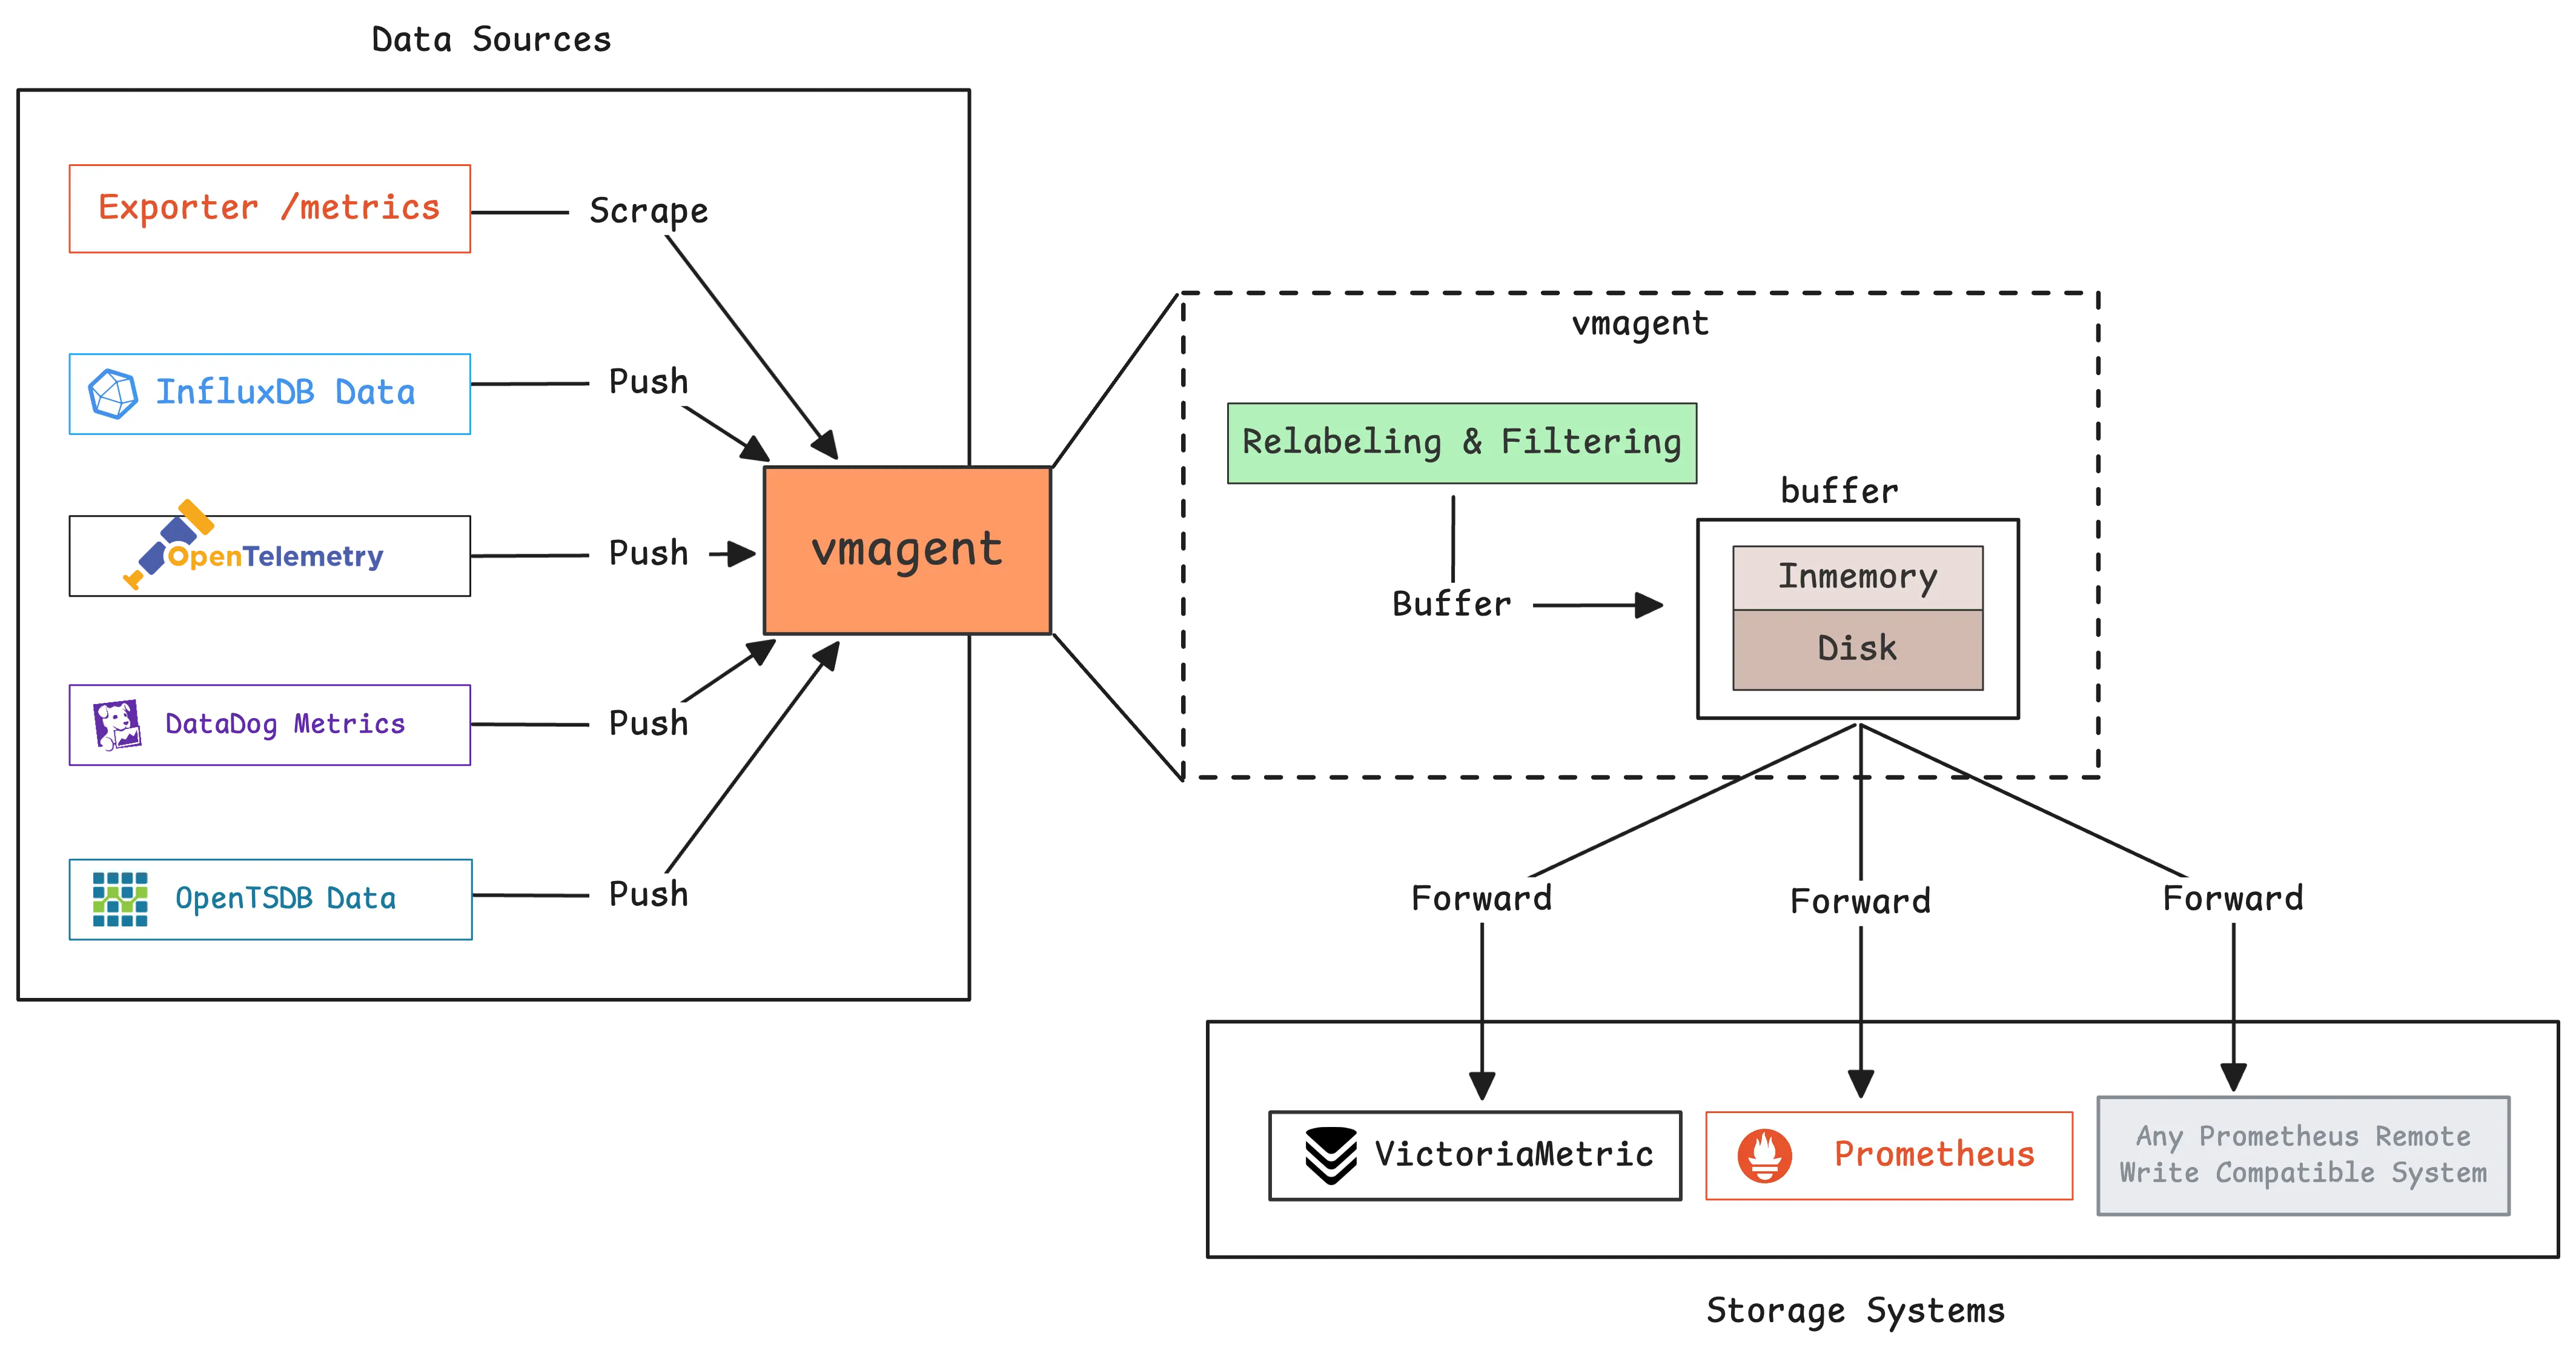
VictoriaMetrics Stack is the new monitoring solution for metrics, logs and also for tracing. It’s becoming compatible for several platform, e.g: Kubernetes and Docker, and they are built from these components below
VictoriaMetrics is a fast, cost-effective and scalable monitoring solution and time series database
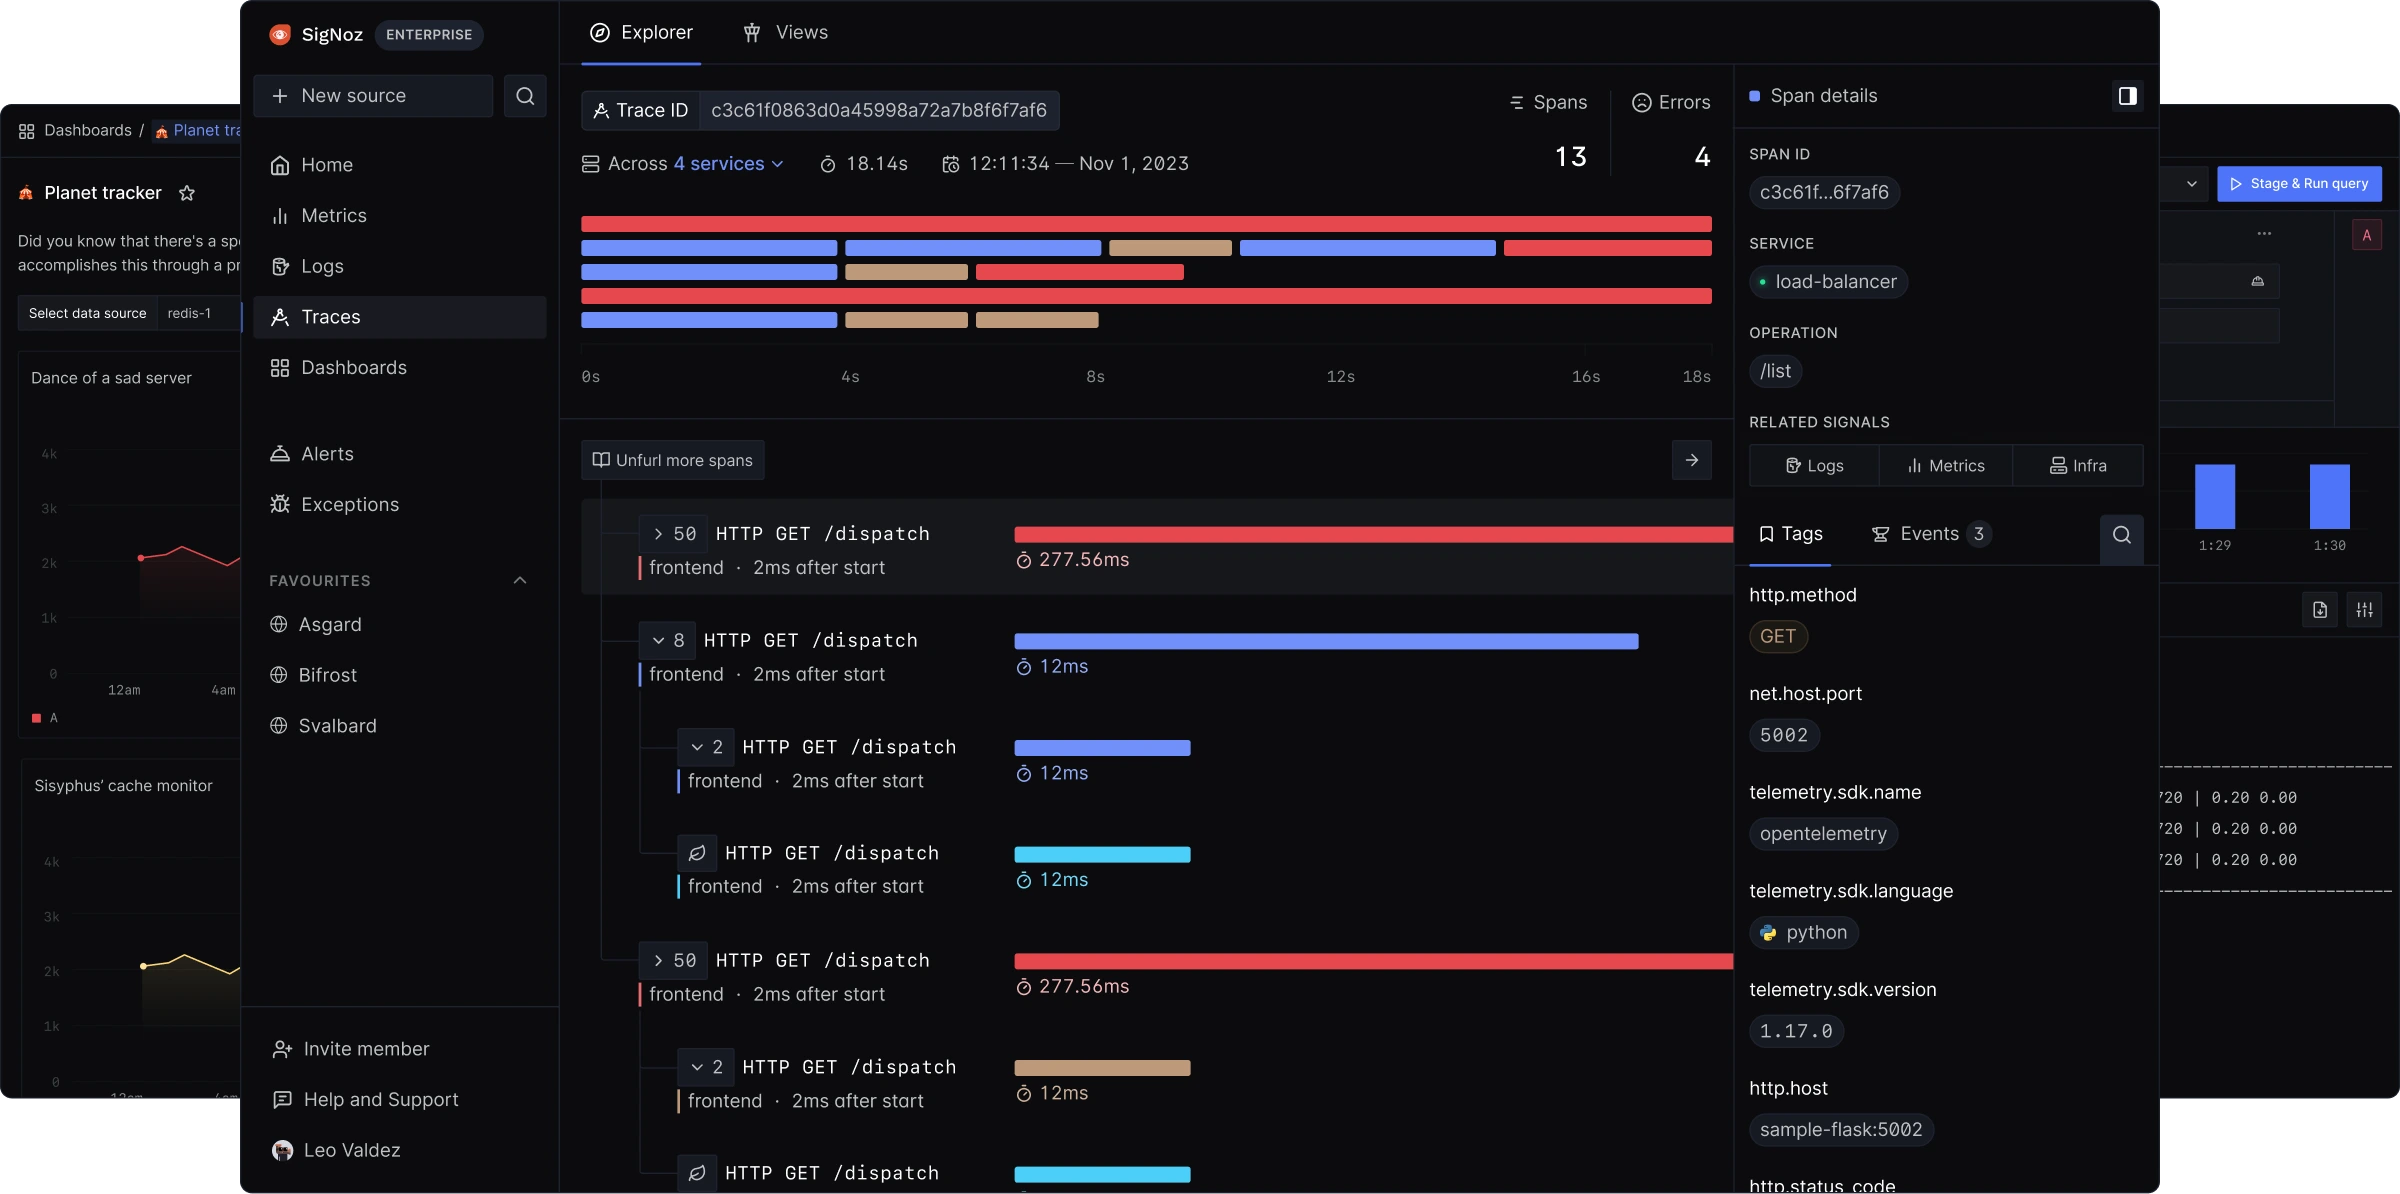
Signoz comes for all-in-one stack for monitoring , and it use and built on the top OpenTelemtry for concept to help you build the monitoring for metrics, logging and tracings. You can find more information about Signoz via resources below
Coroot is an open-source observability and APM tool with AI-powered Root Cause Analysis. It combines metrics, logs, traces, continuous profiling, and SLO-based alerting with predefined dashboards and inspections. You can find more about Coroot via resources below
Monitoring and observability is an incredibly dynamic field that evolves daily, with the aforementioned stacks competing to become the industry standard. As adopters, we benefit from this competition through better features, yet we also face the challenge of constantly modernizing our infrastructure to stay current. In my experience across various companies, I have often encountered outdated monitoring setups. This is why I advocate for exploring modern alternatives, which led me to implement the LGTM stack for my Kubewekend project. You can find more details and explore the implementation in the next section. Let’s move forward.
Kubewekend with LGTM - Playground
Since this is not my first time discussing Monitoring and Observability—specifically the LGTM stack and the broader Grafana/Prometheus ecosystem—I recommend reviewing my previous articles. These resources illustrate how you can leverage these tools within Kubernetes to significantly enhance your monitoring capabilities:
Honestly to say, This is not experience when you first setup the LGTM stack, but I already recap all of them into automation progress with ansible, and I will show you guys how to setup them in the Kubernetes via Kubewekend CLI. But first, let’s take a walk through when we try to setup each components
Prerequisite
You need to prepare the environment for setup LGTM cluster, and I would recommend you to choose the Kubernetes in host instead of in docker, because they can create couple of network blocking and you can face lots of problem to troubleshoot them. Here is the requirements
For to set up the experiment, you can access and clone GitHub - Kubewekend for your machine and start to create new inventory via script setup.sh of Kubewekend
./scripts/setup.sh env check
Info
This one will show your environment that have enough tools and resources to let kubewekend provision Kubernetes cluster for your requirements
Now you can use Vagrant to create VM to testing the LGTM Stack, or you can setup a new hosts bare-metal to let ansible can access and provision K3s Cluster for hosts file in ansible/inventories
# To update new hosts file./scripts/setup.sh inventory set-remote# Check again the available of host./scripts/setup.sh inventory ping
Note
You can create this file manually and modify the ansible-host base on your setup. Fore more information, you can double-check at example at Kubewekend - hosts file
Now you can create the standalone k3s cluster with command
# Rememeber, your host name require `master` for install that in master node./scripts/setup.sh k3s setup --host k8s-master-machine
After that, you can you kubectl command in remote host, which ansible are provisioned K3s for your Kubernetes cluster
kubectl cluster-info
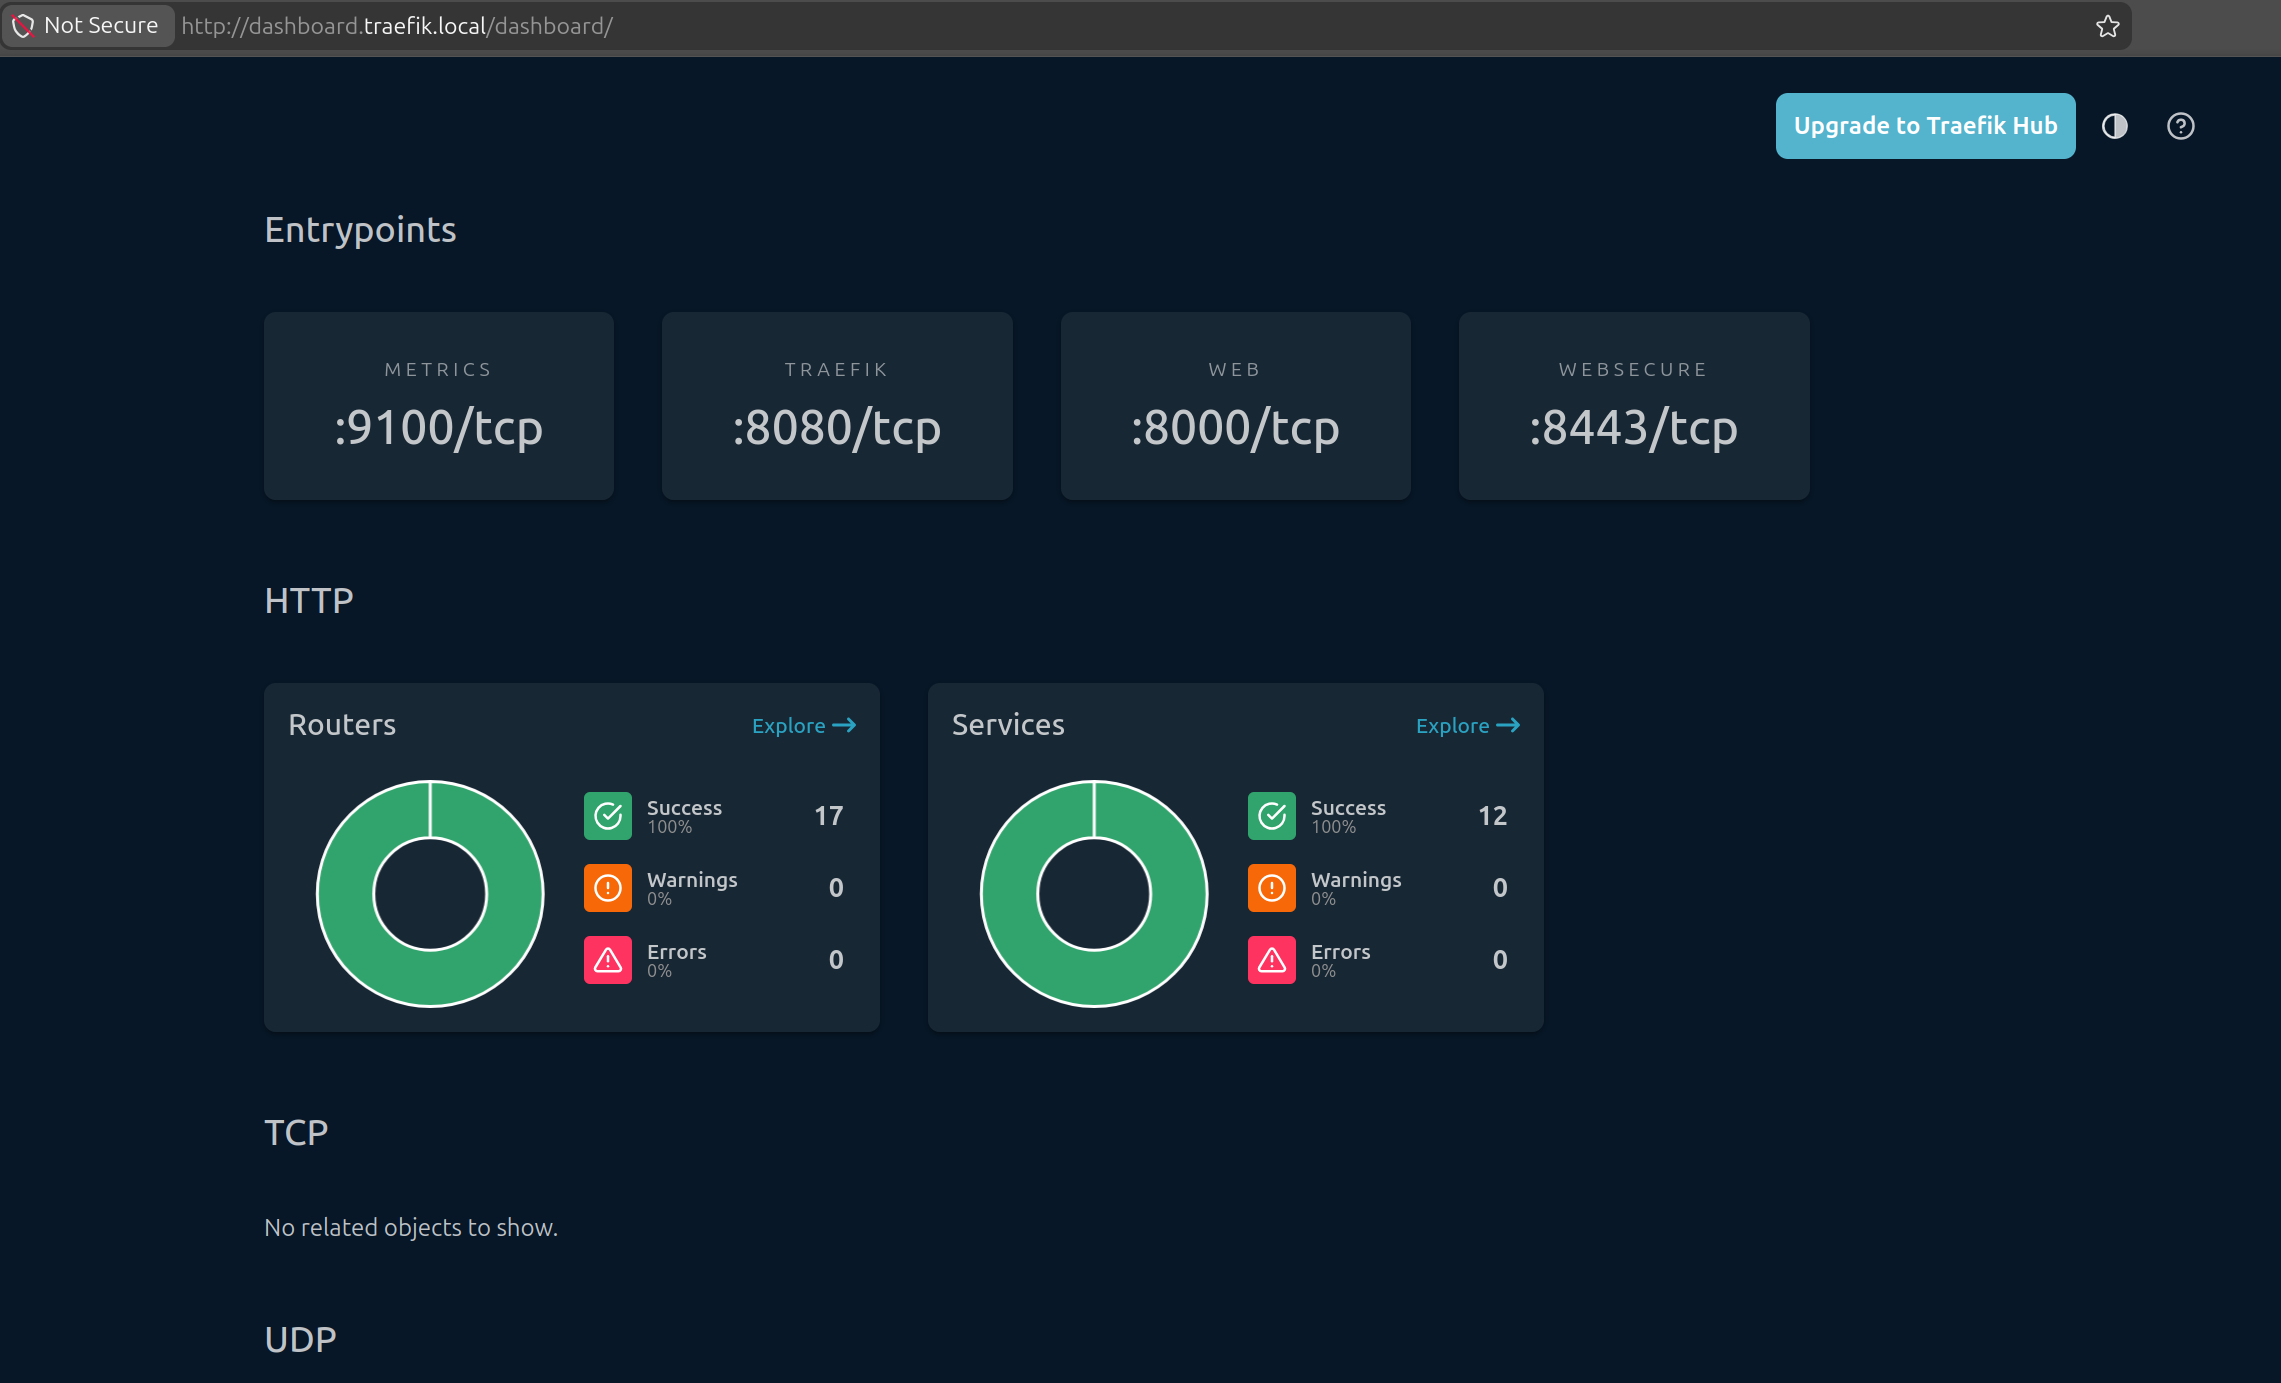
To view your ingress feature work on your host, you can try add to /etc/hosts new definition for traefik ingress dashboard. Because in master.yaml, by default it will enable dashboard and expose at domain dashboard.traefik.local (NOTE: you can define your own domain)
<ip-your-host> dashboard.traefik.local
Success
Now your host and Kubernetes cluster already available to operate LGTM Stack
Setup Kube-Prometheus-Stack
Like other articles, I pretty love to use kube-prometheus-stack for setting the bootstrap Grafana, Prometheus and Alert Manager, the core components of LGTM Techstack. I already wrap the default values.yaml of kube-prometheus-stack to template in ansible, so you can update the value inside the master.yaml for your requirements, for me that will look like this
As you can see, the values.yaml of this stack is pretty huge and honestly, you can miss something actually important, that why if you want to discover, I truly recommend you to read these lines carefully to find the perfect setup. With my setup, I only help you modify couple of special values, including
Enable Stack, include: Grafana, Prometheus and Alert Manager
If you only want to setup step by steps components in LGTM Stack, you need to clone values.yaml each of them, and try modify them base on your configuration. After that, you can use helm command to create new chart
# Add helm repohelm repo add alias URL# Update helm repohelm repo update# Install helm-chart base on alias and values.yamlhelm upgrade --install name-chart-release alias/<chart-name> --namespace <namespace> -f /path/to/values.yaml --wait
Note
I will take a full walkthrough of each components and introduce about that one, before we will apply whole installation at the end with monitoring tags via kubewekend
Setup Loki
For next part, you will setup the Logging component of LGTM with Grafana - Loki, with the new architecture, Loki is non longer to use with Promtail which the one of legacy light-weight log collect and ingest of Loki. But if you want to operate Loki following Promtail or only want to keep the legacy architecture, please take the explore at GitHub - Promtail
With Kubewekend, I will help you to setup the Loki in standalone mode with single instance, but if you want to adopt the Loki in the huge-system with a lot of log traffic everyday, you should take a look at Grafana - Loki Deployment Modes which support various options, including
Monolithic Mode: useful for getting started quickly to experiment with Loki, as well as for small read/write volumes of up to approximately 20GB per day. 🌟 (Recommended for Experiment)
SimpleScalable: Simple scalable deployment mode separates execution paths into read, write, and backend targets. Useful for medium installs easier to manage than distributed, up to a about 1TB/day.
Distributed: The microservices deployment mode runs components of Loki as distinct processes. The most complicated but most capable, useful for large installs, typically over 1TB/day.
To understand about Loki Architecture, you can take a look at Loki Architecture and Loki Components, Loki is designed to microservice-bases architecture and help you can easily horizontal scalable, and so that’s why build multiple component and run them parallel and use WRITE/READ PATH to push and parse the log.
Loki store the data in indexed format in single object storage backend, e.g: S3 or Azure Blob Storage and they called this methodology is index shipper to store index at TSDB or BoltDB, but for my setup, I use my storage PVC to keep index via modify configuration with TSDB again and point them to PVC managed by Longhorn. Here is the whole configuration I will use to adapt the values.yaml of Loki helm-chart, but I try to make it become short version at values.yaml
    logging:
      enable: true
      type: "loki"  # loki
      namespace: "monitoring"
      config:
        # With Alloy APM as collector, you can change the promtail legacy to alloy for better integration
        # But Loki also able to collect logs with promtail, fluentbit, fluentd, filebeat, etc
        collector:
          enable: false
          type: "promtail" # promtail | fluentbit
        deploymentMode: "SingleBinary"
        msgSize:
          server:
            recv: 41943040 # 40MB (In bytes)
            send: 41943040 # 40MB (In bytes)
          client:
            recv: 104857600 # 100MB (In bytes)
            send: 104857600 # 100MB (In bytes)
        auth_enabled: false
        # Loki require object storage for storaging chunks and rulers
        # but for testing purpose, you can use local storage with emptyDir or hostPath,
        # but it's not recommended for production cluster
        storage:
          type: "filesystem" # filesystem
          persistence:
            enable: true
            storageClassName: "longhorn"
            size: "5Gi"
        # Enable tracing for Loki, which is useful for debugging and performance analysis of Loki itself,
        # and also for better integration with Tempo and other tracing solutions in the cluster
        tracing: true
        # Enable pattern_ingester
        pattern_ingester: false
        # ruler
        ruler:
          enable: false
          persistence:
            enable: true
            storageClassName: "longhorn"
            size: "1Gi"
By Kubewekend, These configuration will let you define
Namespace
Collector (Not Supporting) - Use Grafana Alloy Instead
DeploymentMode: Currently support only SingleBinary for Monolithic Loki Architecture
Storage Configuration: File System (Store in PVC), StorageClassName and Size of PVC
Enable Tracing to better integrate with Tempo
Enable Ruler Components
Setup Tempo
Next, we go to setup Grafana Tempo for tracing in LGTM TechStack, because Tempo in the modern architecture use Grafana Alloy as the agent to collect trace data, transform and send them to Tempo Backend instead of directly compare with previous version. You can explore at Tempo Architecture and Components
Why I said that because the trace journey usually come from an instrumented application, popularly you can know as well is OpenTelmetry SDK supported wide-range languages, to a trace receiver/collector which can process the incoming trace spans before batching them up and sending them to a trace backend store (such as Tempo), and then those traces being retrieved and visualized in a tool like Grafana.
Tempo will take two majors capacities
An ingester of trace span, sorting the span resources and attributes into columns in an Apache Parquet schema, before sending them to object storage for long-term retention.
Retrieving trace data from storage, either by specific trace ID or by search parameters via TraceQL.
Nowadays, you have many options to instrumentation, such as manual instrumentation, auto-instrumentation, Zero-code instrumentation with Grafana Beyla or Hybrid instrumentation combines auto and manual instrumentation
Same as Loki, Tempo recommend use Object Storage for storing all tracing data, and support three major object storage API for S3, GCS or AS. But for experiment, Tempo also allow you to keep data in your local storage and you can configure LongHorn to help you provision new PVC and attached into Tempo
By Kubewekend, with configuration simple help you to define
Namespace
Storage PVC with StorageClassName and Size
Configuration Message size
Setup Pyroscope
Old Version
New Version
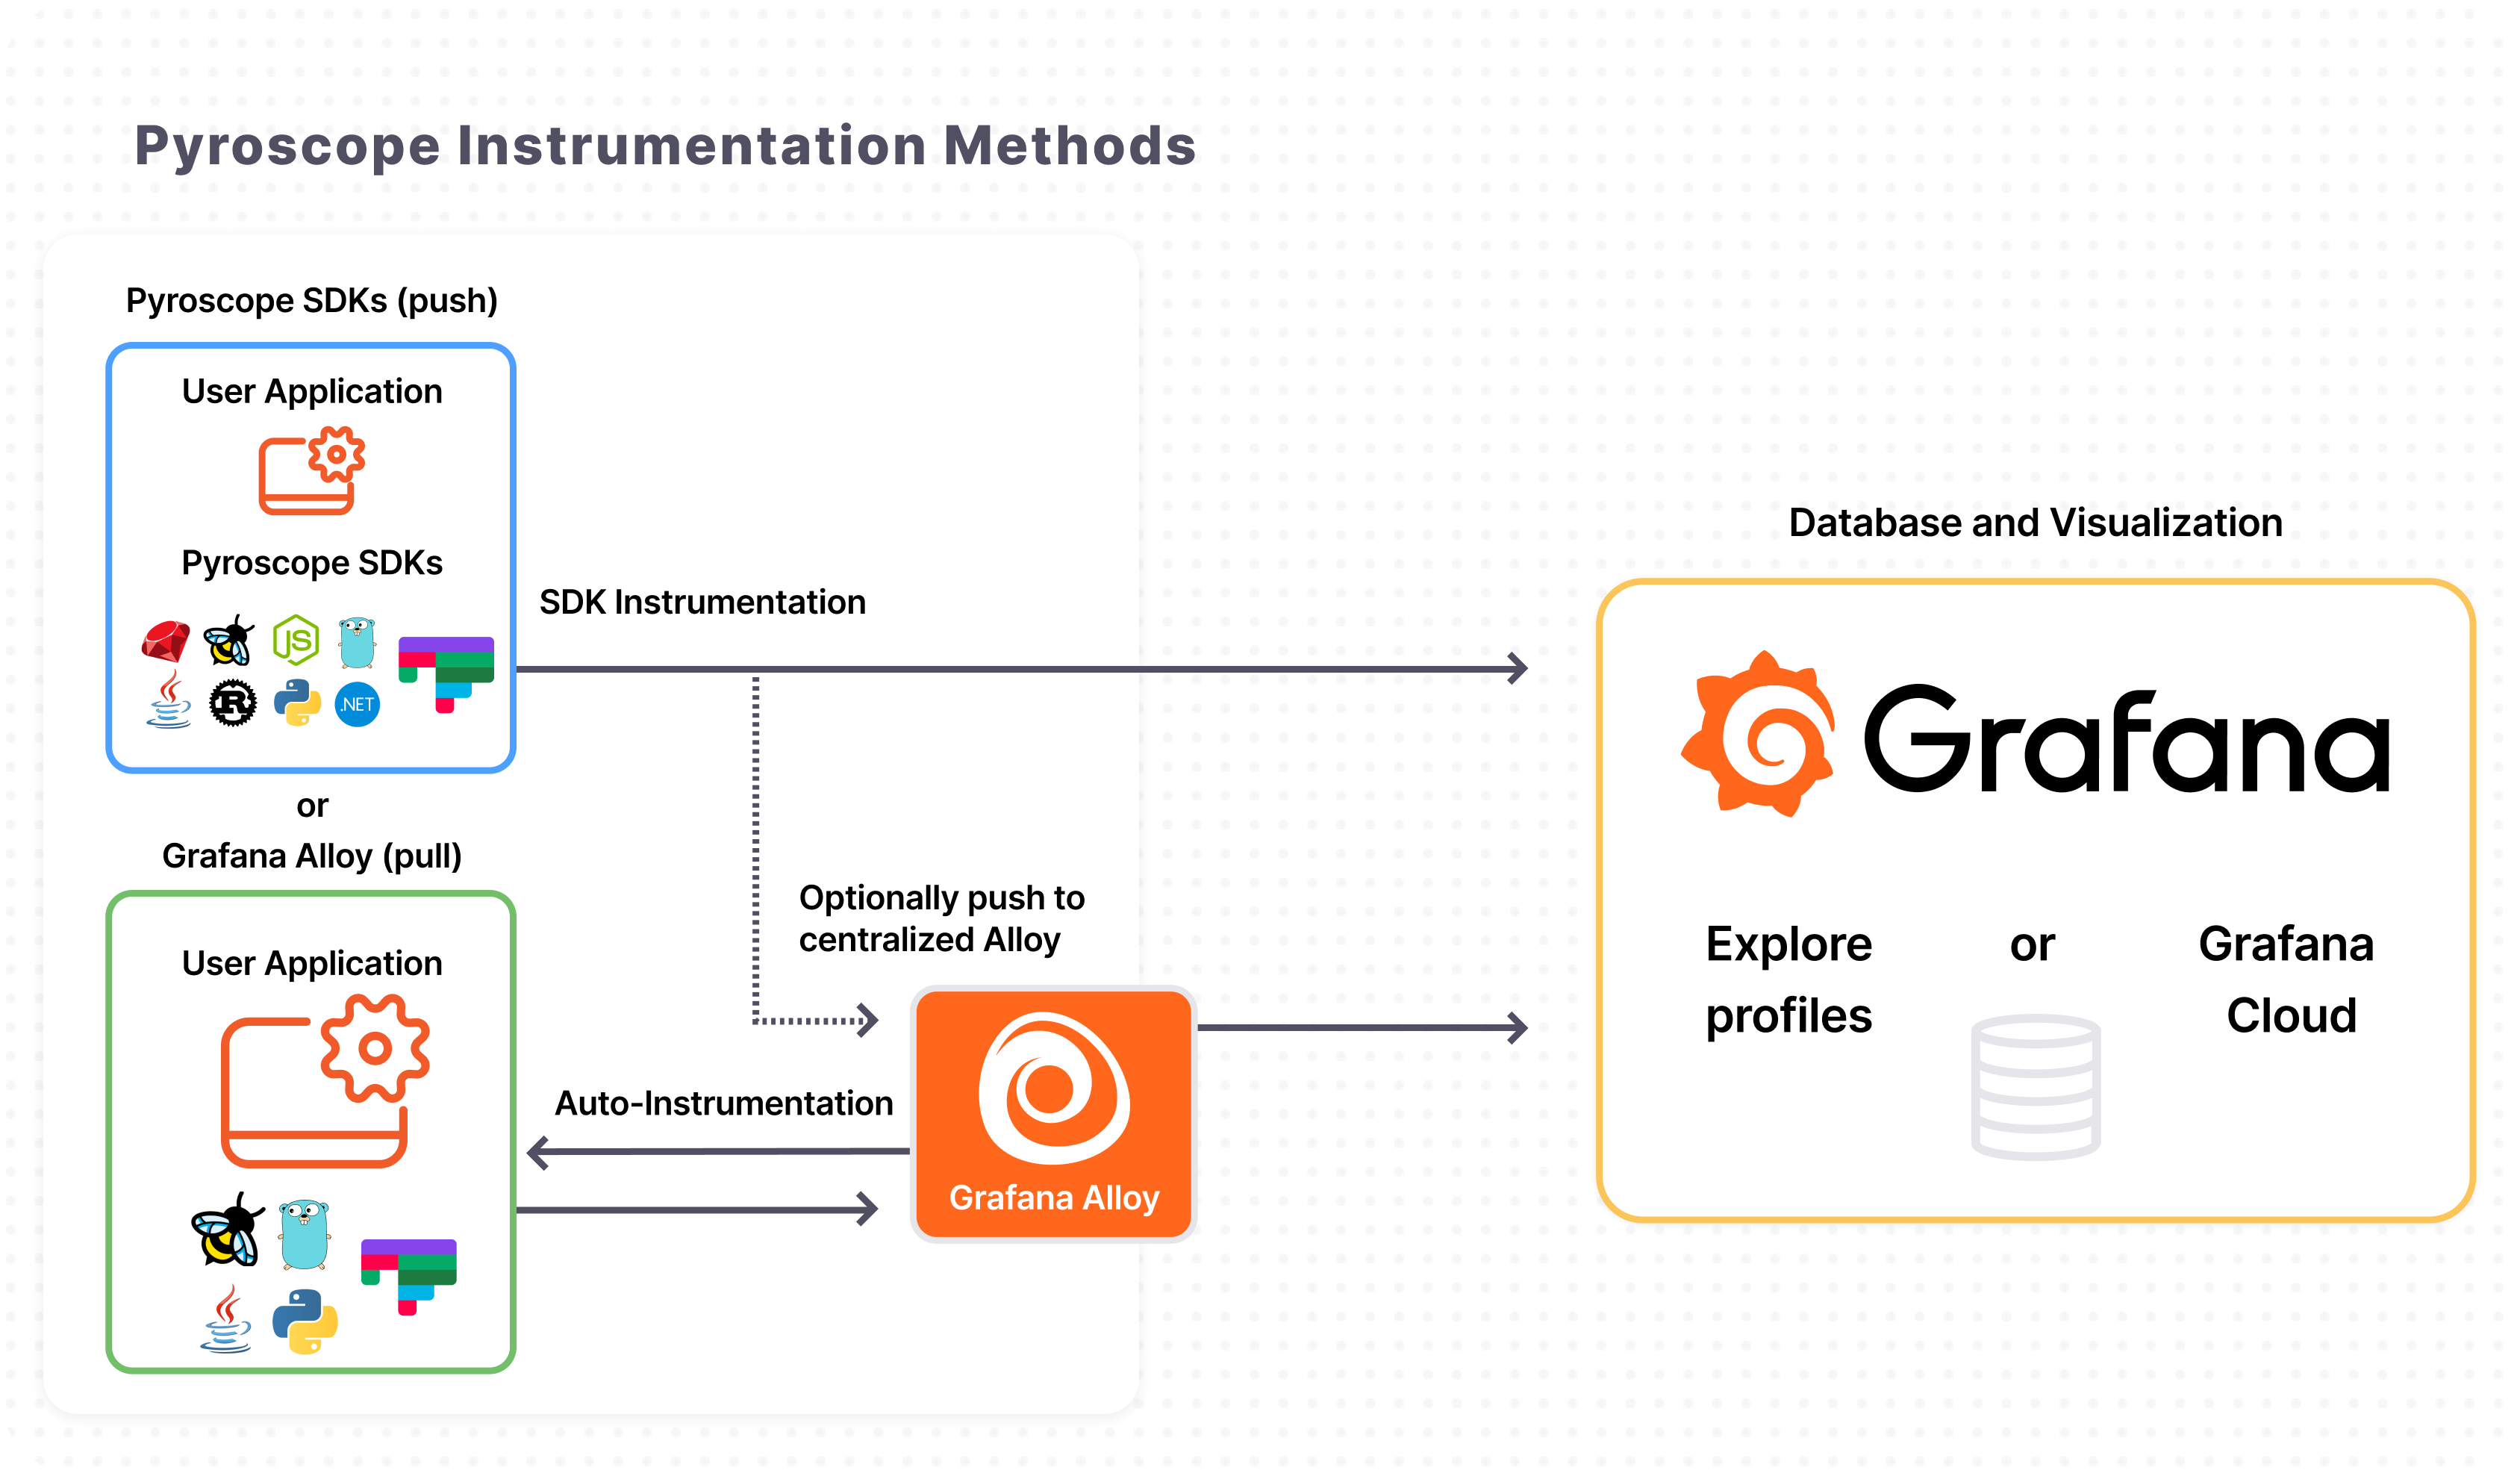
For Profiling, I utilize Grafana Pyroscope, a multi-tenant, continuous profiling aggregation system. Its architecture is aligned with Grafana Mimir, Loki, and Tempo, enabling the seamless correlation of profiling data with existing metrics, logs, and traces.
To better understand the role of Pyroscope in continuous profiling, you can explore resources on What is profiling?, Profiling types and their uses, and Flame graphs. By leveraging eBPF and dedicated SDKs, Pyroscope facilitates deep-level application analysis to identify and resolve performance bottlenecks within complex systems—a critical capability in modern observability.
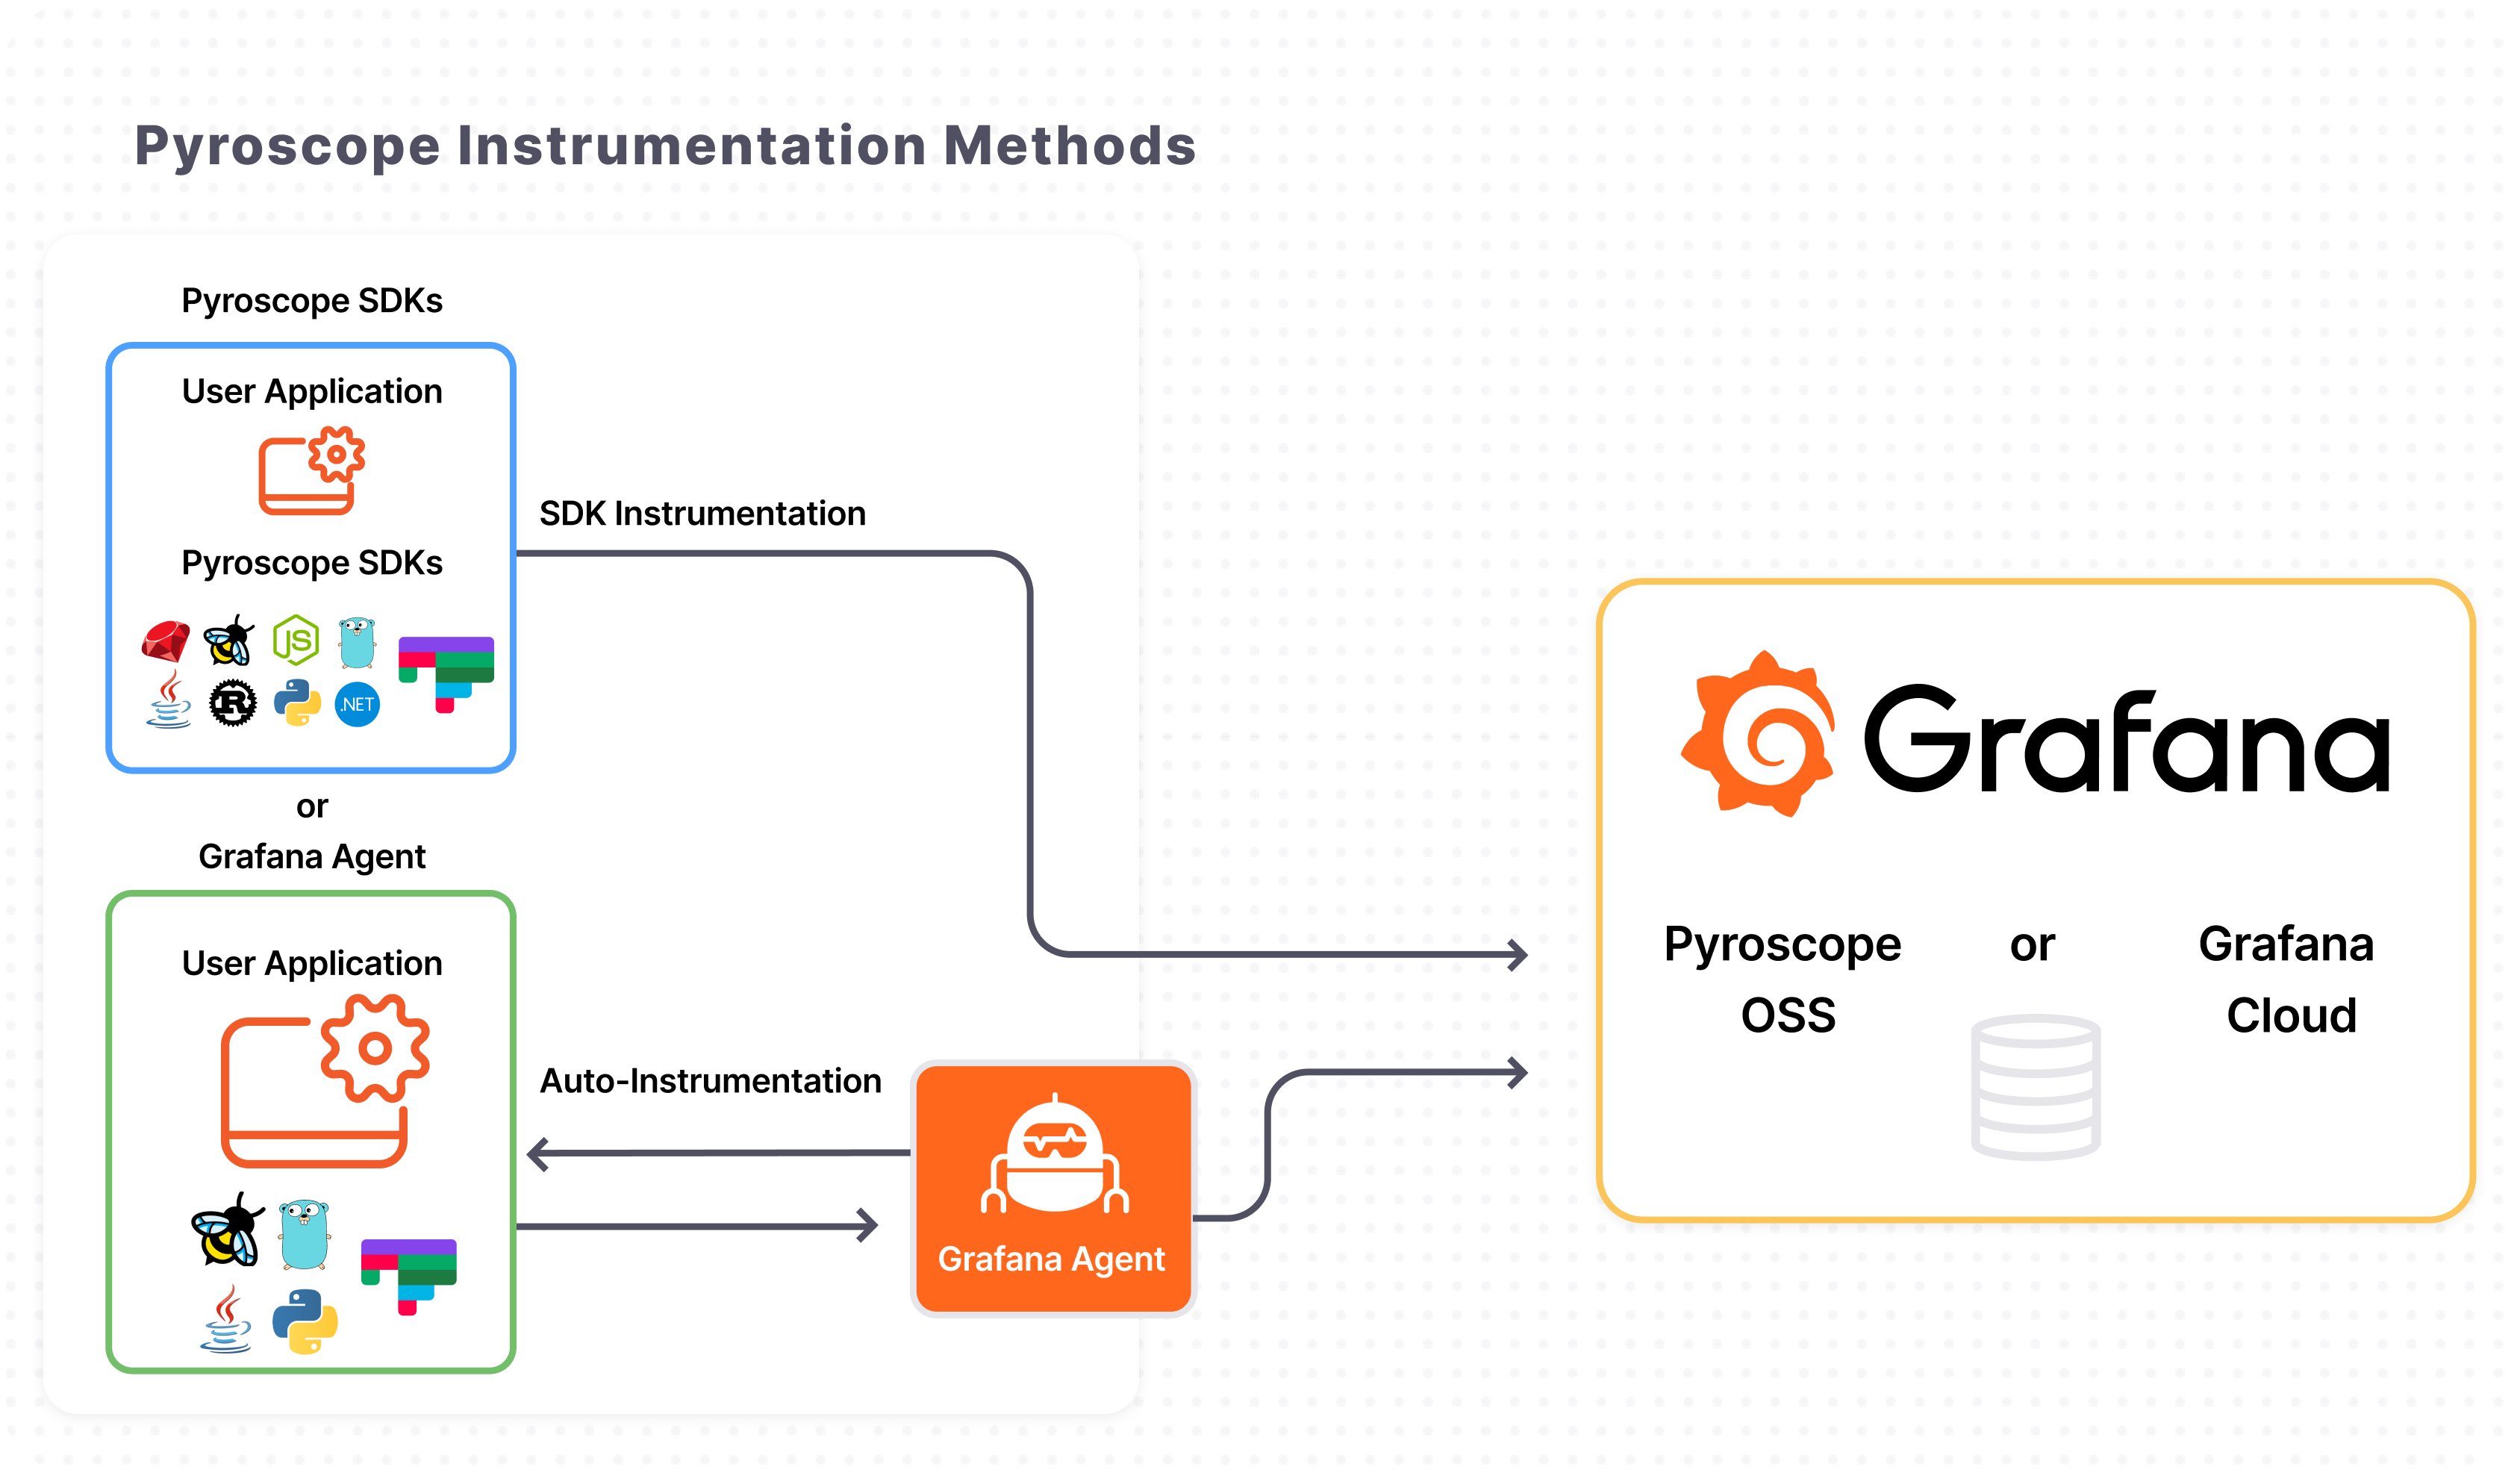
Grafana Alloy serves as the primary collector for Pyroscope. You can configure Alloy to pull profiling data from specific applications without any code modifications, a process further simplified by eBPF-based profiling which requires no manual push or pull configurations. Beyond auto-instrumentation, Pyroscope SDKs allow you to push profiling data either to Alloy or directly to Pyroscope for storage. This highlights the flexibility of the LGTM stack, providing a highly customizable environment through both manual and auto-instrumentation options.
That look same as the other components to allow you setup
Namespace
Persistence Storage for Pyroscope
Setup Grafana Alloy
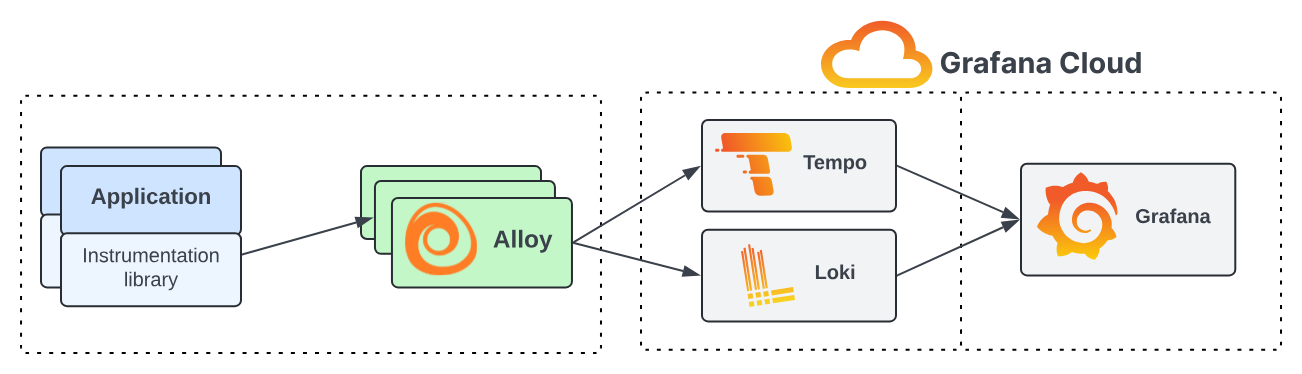
Finally, we implement Grafana Alloy, which consolidates the strengths of leading collectors into a single, unified agent. Whether you are observing applications, infrastructure, or a hybrid environment, Alloy enables you to collect, process, and export telemetry signals, providing a scalable and future-proof approach to observability.
As an OpenTelemetry-native solution, Grafana Alloy reduces the operational overhead of managing multiple distinct agents across various technology stacks. By providing a single solution for all telemetry types, it simplifies maintenance and streamlines your architecture. For a deeper dive into its benefits, refer to the Why Alloy documentation.
Alloy functions as a telemetry pipeline sitting between your data sources and storage backends. It acts as a bridge by performing three core operations:
Collect telemetry data.
Transform and process data.
Send data to backends.
Alloy is built using modular components that serve as functional building blocks. Each component handles a specific task, such as scraping Prometheus endpoints, receiving OpenTelemetry data, or filtering telemetry before egress. It utilizes an expression-based configuration language that allows components to reference each other, enabling dynamic configurations that adapt to changing conditions. You can leverage built-in functions for data manipulation or create and share custom components. This modularity makes Alloy exceptionally powerful for establishing deep integration between the various components of the LGTM stack.
You can define configuration below for template Alloy with Kubewekend
    # APM for the cluster as Observability agent collector for Metrics, Logs, Traces and several stuff of Application
    apm:
      enable: true
      type: "alloy" # alloy (compatible with OpenTelemetry Collector)
      namespace: "monitoring"
      config:
        clusterName: "kubeweekend" # Cluster name for labeling and identification in monitoring and observability tools
        collected:
          logs:
            enable: true
          traces:
            enable: true
          profiles:
            enable: false
            # NOTE: eBPF require privileged SecurityContext for Alloy container to run with root permissions,
            # and also specific PID to collect host-level profiling data
            # For normal usage, it's recommended to use "scrape" mode, but for complex analysis the leaking or performance issue
            # in the cluster, you can use "ebpf" mode for better visibility into the cluster performance and behavior
            pyroscope: "scrape" # scrape | ebpf
Through the configuration, you can define:
Namespace
Collected Data Types: Logs, Traces, and Profiling
Success
Due to the complexity of the LGTM stack and its individual components, providing a detailed explanation for each here would make this article overly dense and difficult to approach. Consequently, I will break these topics into smaller, more focused segments in future posts to provide a deeper dive into each specific area.
Combine them to LGTM
For creating LGTM stack for my own, I try to read and practice in multiple resources, and I believe these ones can valid to follow, and I already give them a try
As you can see, To connect and combine them into one, Grafana Alloy is submit the critical role to collect many data from multiple-datasource and send them to specific backend and help them can able visualization in Kubernetes. These configuration will setup inside alloy-values.yaml, which generated by via alloy-values-templates.yaml and managed by Kubewekend
For Logging, you can explore Grafana - Collect Kubernetes logs and forward them to Loki, this guide is pretty insane for help you understand what components should be used to collect full stack Kubernetes Logs and sent them into Loki at the end. You can collect many stuff in your Kubernetes system, including
      // Collect cluster events (requires running with elevated permissions)
      // loki.source.kubernetes_events tails events from the Kubernetes API and converts them
      // into log lines to forward to other Loki components.
      loki.source.kubernetes_events "cluster_events" {
        job_name   = "integrations/kubernetes/eventhandler"
        log_format = "logfmt"
        forward_to = [
          loki.process.cluster_events.receiver,
        ]
      }
Configuration OLTP HTTP and GRPC for allowing write from other otelcol components
      // `otelcol.exporter.oltp` accepts telemetry data from other otelcol components and writes them over the network using the OTLP gRPC protocol.
      // Explore more at: https://grafana.com/docs/alloy/latest/reference/components/otelcol/otelcol.exporter.otlp/
      // Define an OTLP gRPC exporter to send all received traces to GET.
      // The unique label 'tempo' is added to uniquely identify this exporter.
      otelcol.exporter.otlp "tempo" {
        client {
          endpoint = "tempo.monitoring.svc.cluster.local:4317"
          tls {
            insecure = true
            insecure_skip_verify = true
          }
        }
      }

      // `otelcol.exporter.otlphttp` accepts telemetry data from other otelcol components and
      // writes them over the network using the OTLP HTTP protocol.
      // Explore more at: https://grafana.com/docs/alloy/latest/reference/components/otelcol/otelcol.exporter.otlphttp/
      otelcol.exporter.otlphttp "tempo" {
        client {
          endpoint = "http://tempo.monitoring.svc.cluster.local:4318"
          tls {
            insecure = true
            insecure_skip_verify = true
          }
        }

      }
Configuration OLTP Receiver for help Alloy listening in port 4317 for OLTP over gRPC and 4318 for OLTP over HTTP, and also setup them include metadata of request for help your know more information about trace
      // `otelcol.receiver.otlp` accepts OTLP-formatted data over the network and forwards it to other otelcol.* components.
      // Explore more at: https://grafana.com/docs/alloy/latest/reference/components/otelcol/otelcol.receiver.otlp/
      otelcol.receiver.otlp "otlp_receiver" {
        // Listen on all available bindable addresses on port 4317 (which is the
        // default OTLP gRPC port) for the OTLP protocol
        grpc {
          endpoint = "0.0.0.0:4317"
          // By default this value will be false
          include_metadata = true
        }
        // Listen on all available bindable addresses on port 4318 for OTLP over HTTP
        http {
          endpoint = "0.0.0.0:4318"
          // By default this value will be false
          include_metadata = true
        }
        // Output straight to the OTLP gRPC exporter. We would usually do some processing
        // first, most likely batch processing, but for this example we pass it straight
        // through.
        output {
          traces = [otelcol.processor.k8sattributes.otel_k8sattributes.input]
          // logs = [otelcol.processor.k8sattributes.otel_k8sattributes.input]
          // metrics = [otelcol.processor.k8sattributes.otel_k8sattributes.input]
        }
      }
Setup K8s Attribute base on the metadata to add them to the resources attributes of spans, logs and metrics
      // `otelcol.processor.k8sattributes` accepts telemetry data from other otelcol components
      // and adds Kubernetes metadata to the resource attributes of spans, logs, or metrics.
      // Explore more at: https://grafana.com/docs/alloy/latest/reference/components/otelcol/otelcol.processor.k8sattributes/
      otelcol.processor.k8sattributes "otel_k8sattributes" {
        wait_for_metadata = true
        // Issue: https://github.com/grafana/alloy/issues/2640#issuecomment-2698231302, https://github.com/grafana/alloy/issues/2640#issuecomment-2821019766
        extract {
          metadata = [
            "k8s.deployment.name",
            "k8s.namespace.name",
            "k8s.node.name",
            "k8s.pod.name",
            "k8s.pod.uid",
            "k8s.pod.start_time",
          ]
        }
        output {
          traces = [otelcol.processor.batch.otel.input]
          // logs = [otelcol.processor.batch.otel.input]
          // metrics = [otelcol.processor.batch.otel.input]
        }
      }
At the setup the batch for sent trace data to improve compression and reduce number of outgoing network requests
      // `otelcol.processor.batch` accepts telemetry data from other otelcol components and places them into batches.
      // Batching improves the compression of data and reduces the number of outgoing network requests required to transmit data.
      // This processor supports both size and time based batching.
      // Explore more at: https://grafana.com/docs/alloy/latest/reference/components/otelcol/otelcol.processor.batch/
      otelcol.processor.batch "otel" {
        timeout = "5s"
        send_batch_size = 100
        send_batch_max_size = 150
        output {
          traces = [otelcol.exporter.otlp.tempo.input, otelcol.exporter.otlphttp.tempo.input]
          // logs = [otelcol.exporter.loki.loki.input]
          // metrics = [otelcol.exporter.prometheus.prometheus.input]
        }
      }
With these configuration, you are already setup LGTM for fully monitoring stack, now you can apply them via Kubewekend CLI with utilities tag called monitoring
./scripts/setup.sh k3s utils monitoring
The command will trigger ansible-playbook command to multiple help-command to operate LGTM Stack with specific values file via templates corresponding. At the end, you can get full pod and configuration in monitoring namespace via kubectl
You are already setup LGTM from scratch to complete, and know you can use them to observe your application inside Kubernetes with support OpenTelementry
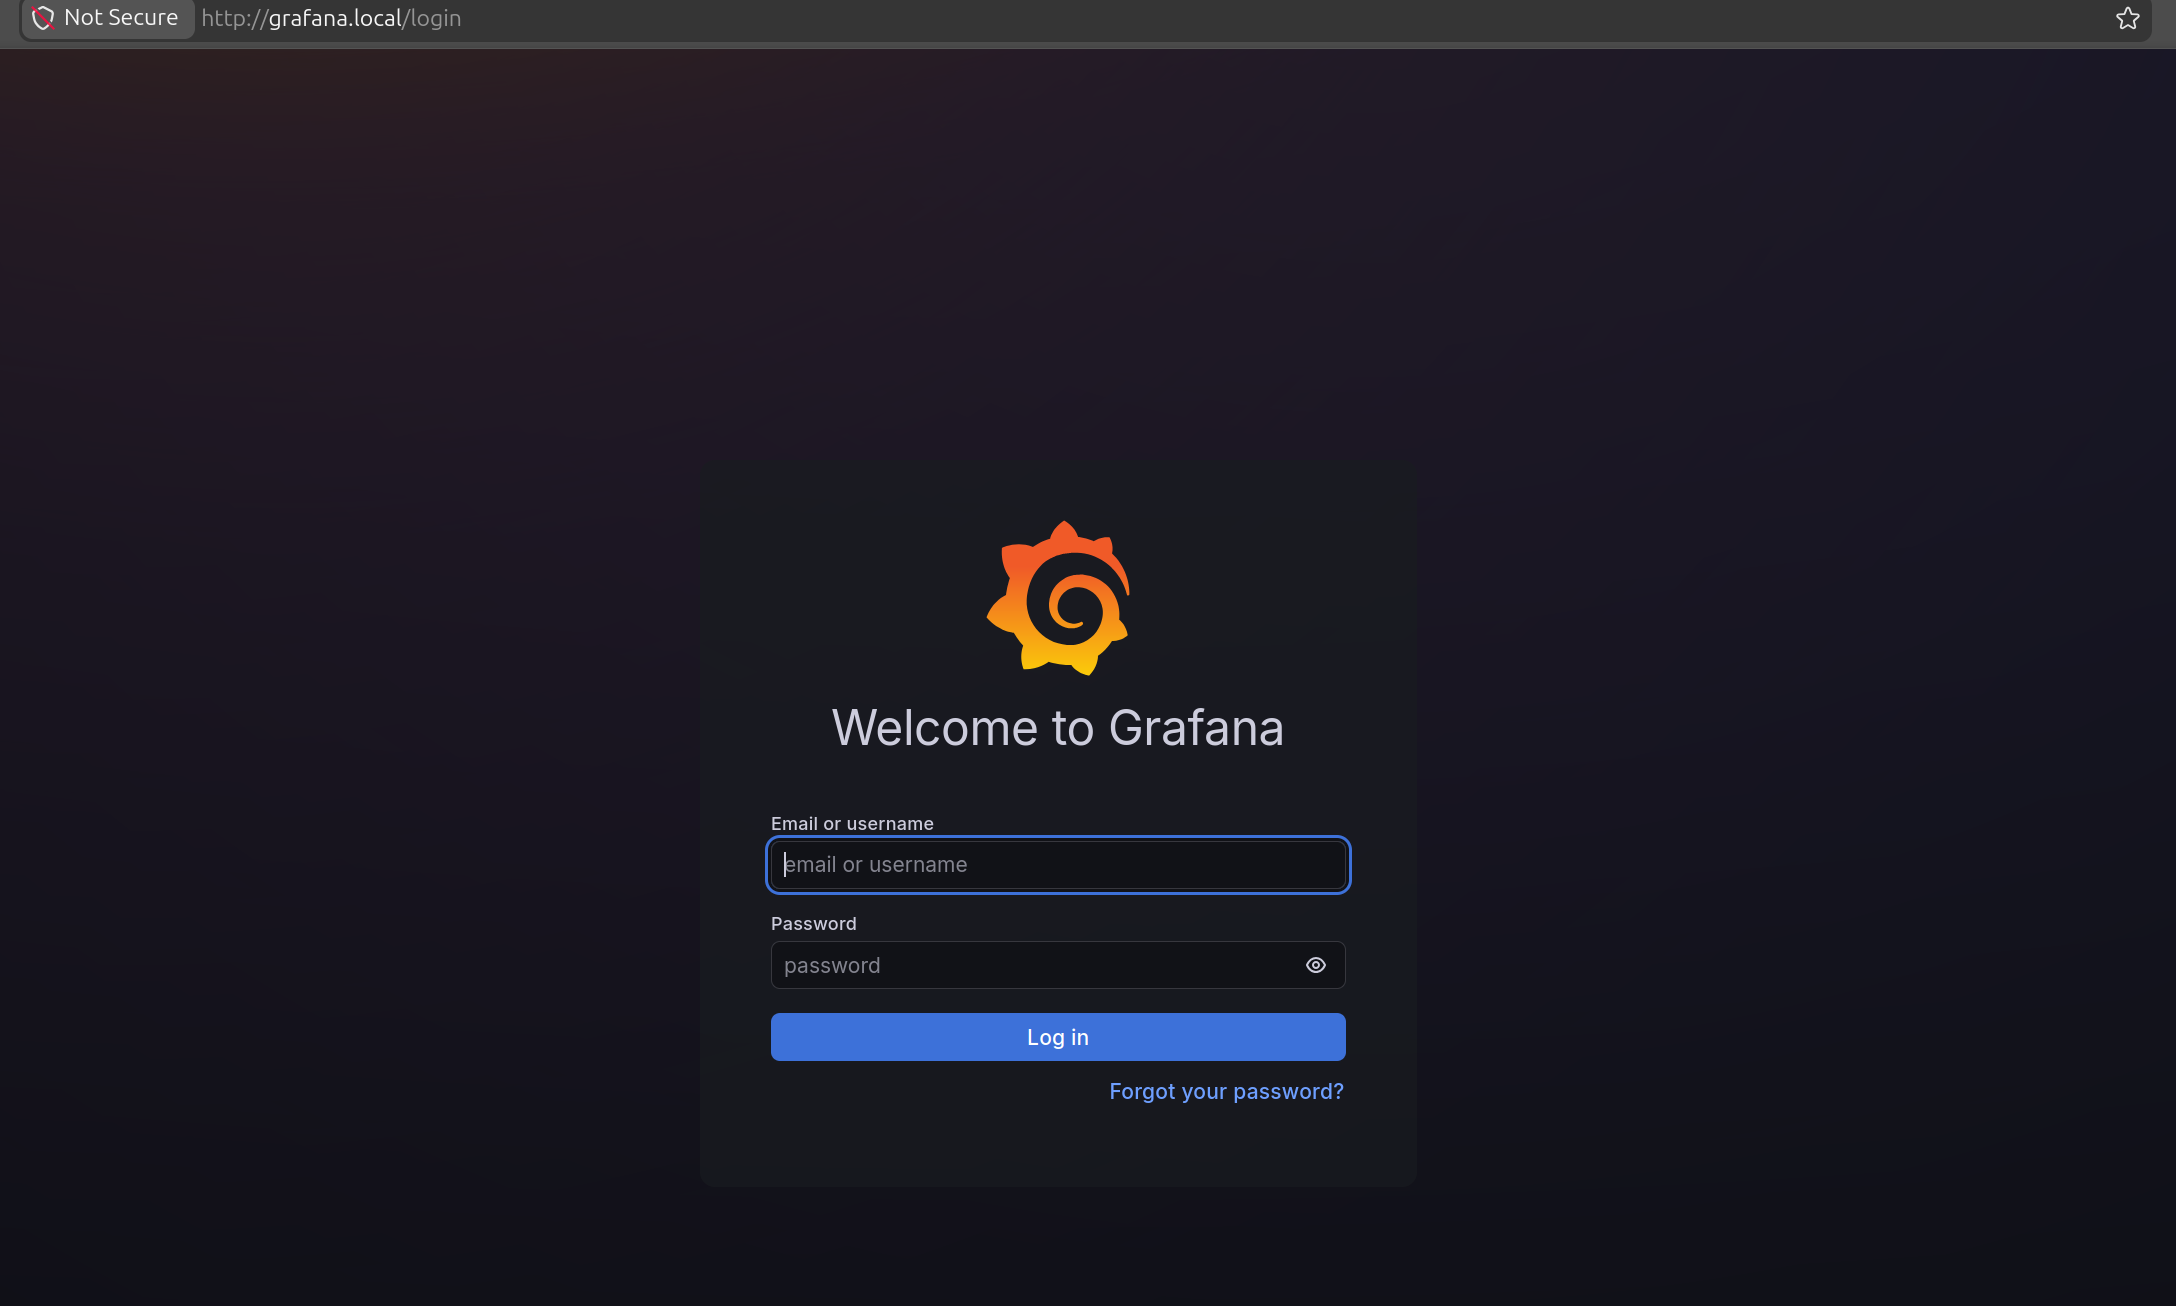
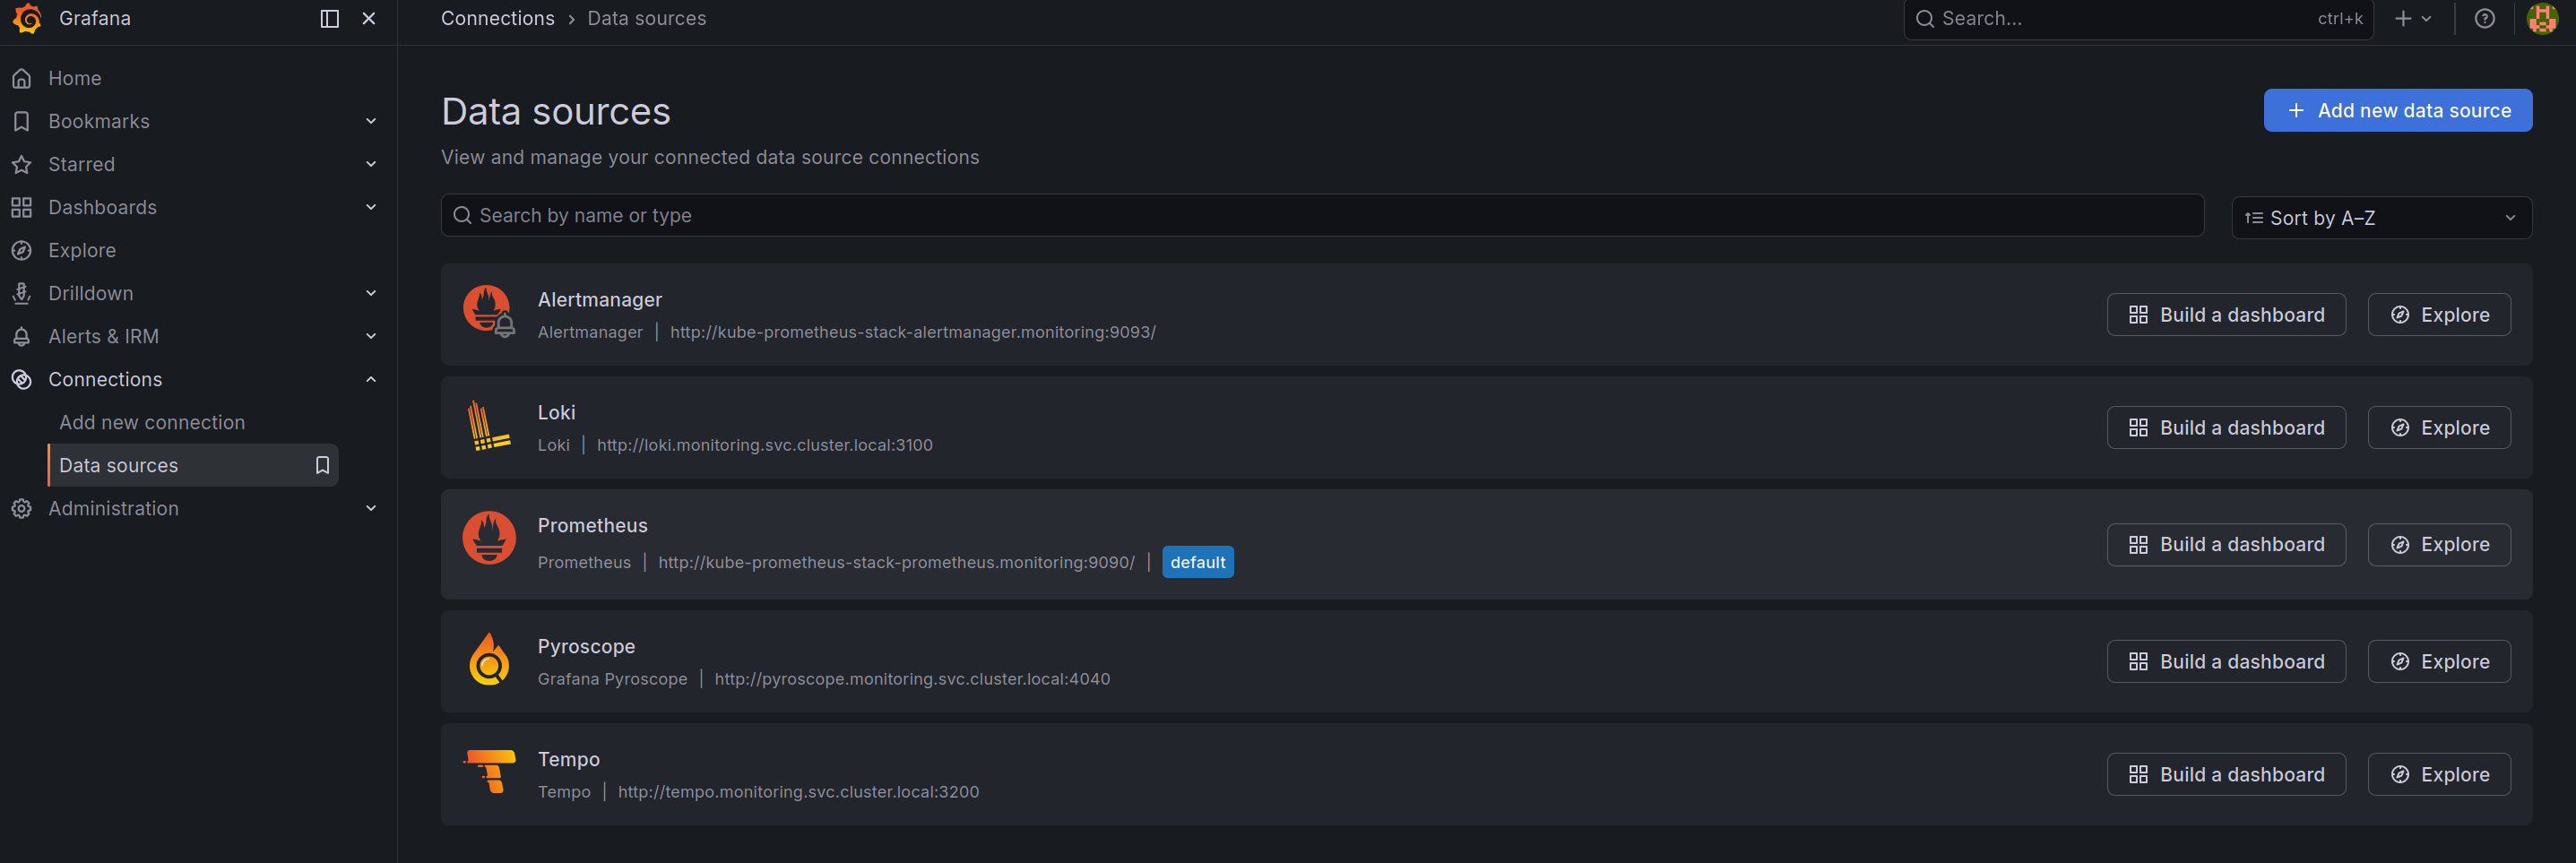
Now login to Grafana and access to Data Sources configuration at Connections > Data Sources
As you can see, all LGTM stack already add into Grafana via addition data-source in values.yaml of kube-prometheus-stack, like below
    datasources:
      enabled: true
      defaultDatasourceEnabled: true
      isDefaultDatasource: true

      name: Prometheus
      uid: prometheus

      ## Extra jsonData properties to add to the datasource
      extraJsonData:
        # NOTE: This require for Prometheus can link to Tempo datasource for trace to metrics
        exemplarTraceIdDestinations:
          - datasourceUid: Tempo
            name: trace_id
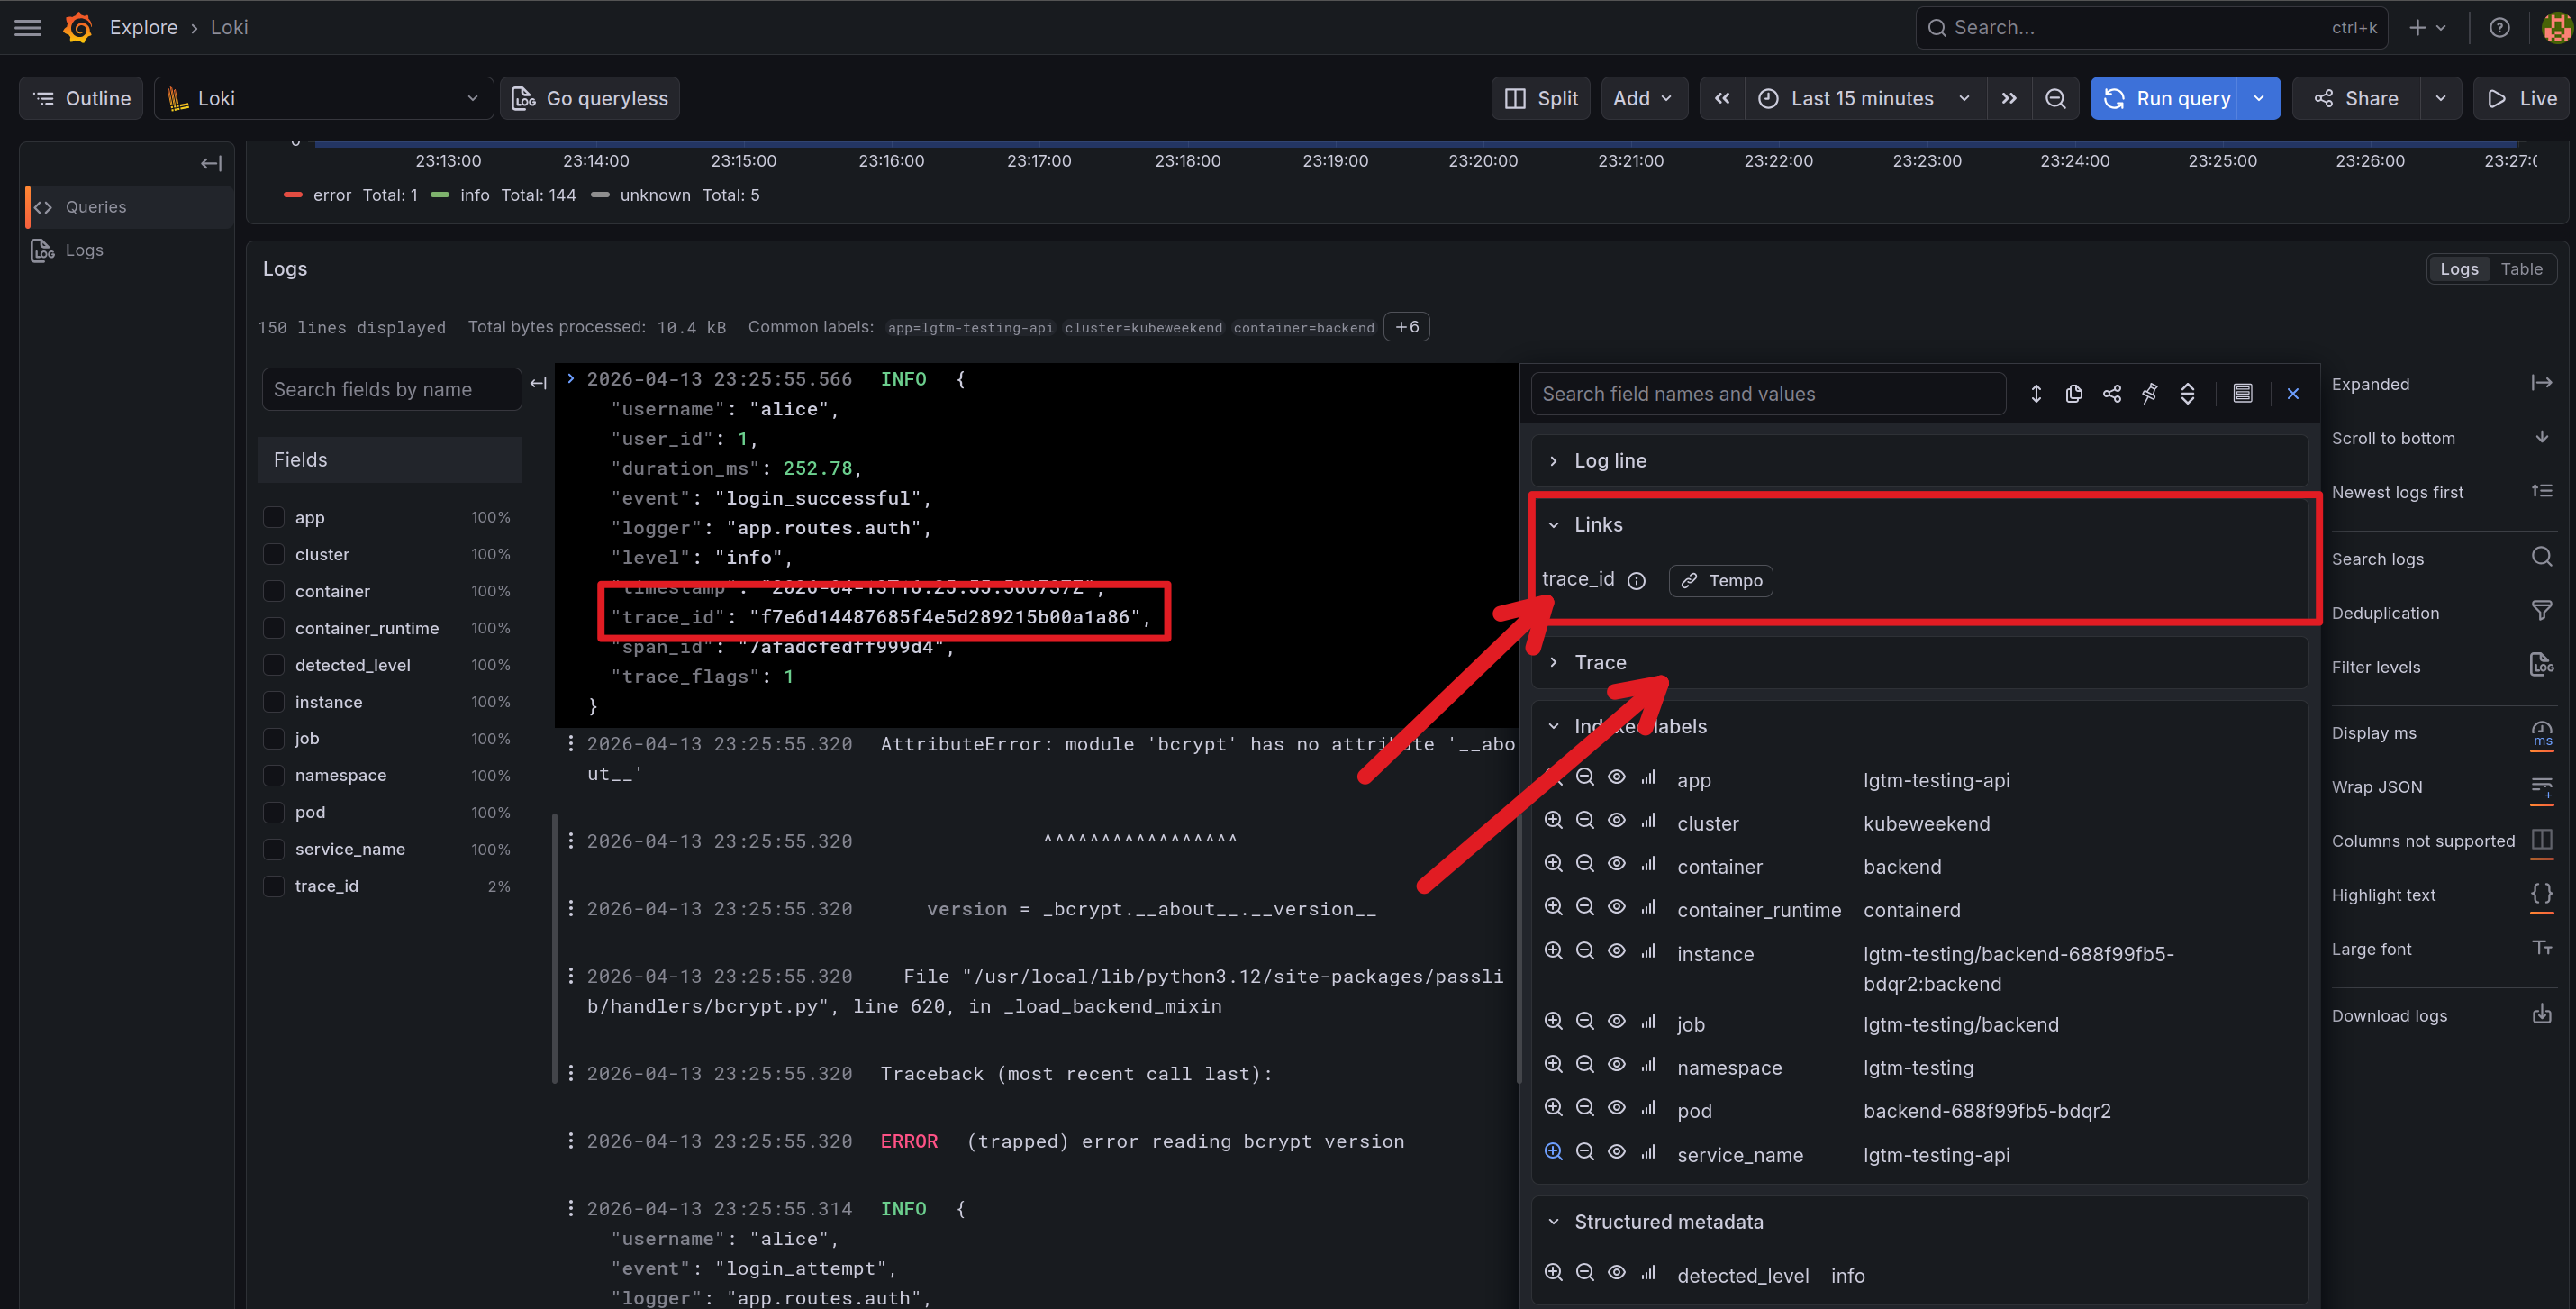
  additionalDataSources:
    # Explore about Loki datasource: https://grafana.com/docs/grafana/latest/datasources/loki/
    - name: Loki
      type: loki
      access: proxy
      url: http://loki.monitoring.svc.cluster.local:3100
      isDefault: false
      jsonData:
        maxLines: 1000
        # Support for add-on filters in explore of Loki, and if match with your regex,
        # that will show the link to explore trace in Tempo datasource
        derivedFields:
          - datasourceUid: Tempo
            matcherRegex: '"trace_id": "(\w+)"'
            name: trace_id
            url: "$${__value.raw}"
    # Explore about Tempo datasource: https://grafana.com/docs/grafana/latest/datasources/tempo/
    - name: Tempo
      type: tempo
      access: proxy
      url: http://tempo.monitoring.svc.cluster.local:3200
      isDefault: false
      jsonData:
        tracesToProfiles:
          datasourceUid: 'Pyroscope'
          tags: []
          profileTypeId: 'process_cpu:cpu:nanoseconds:cpu:nanoseconds'
        tracesToMetrics:
          datasourceUid: 'Prometheus'
          spanStartTimeShift: '-15m'
          spanEndTimeShift: '15m'
          tags: [{key: 'k8s.pod.name', value: 'pod'}]
          # Explore more at setup tags and spans for query
          # 1. https://grafana.com/docs/grafana/latest/datasources/tempo/configure-tempo-data-source/#set-up-custom-queries
          # 2. https://grafana.com/docs/grafana/latest/datasources/tempo/configure-tempo-data-source/#custom-query-variables
          queries:
            - name: 'CPU Usage'
              query: 'sum(node_namespace_pod_container:container_cpu_usage_seconds_total:sum_rate5m{$$__tags})'
            - name: 'Memory Usage'
              query: 'sum(rate(node_namespace_pod_container:container_memory_working_set_bytes{$$__tags}[5m]))'
        serviceMap:
          datasourceUid: 'Prometheus'
        nodeGraph:
          enabled: true
    # Explore about Pyroscope datasource: https://grafana.com/docs/grafana/latest/datasources/pyroscope/
    - name: Pyroscope
      type: grafana-pyroscope-datasource
      access: proxy
      url: http://pyroscope.monitoring.svc.cluster.local:4040
      isDefault: false
With these configuration data-sources, it will create the linked between components in LGTM stack, including
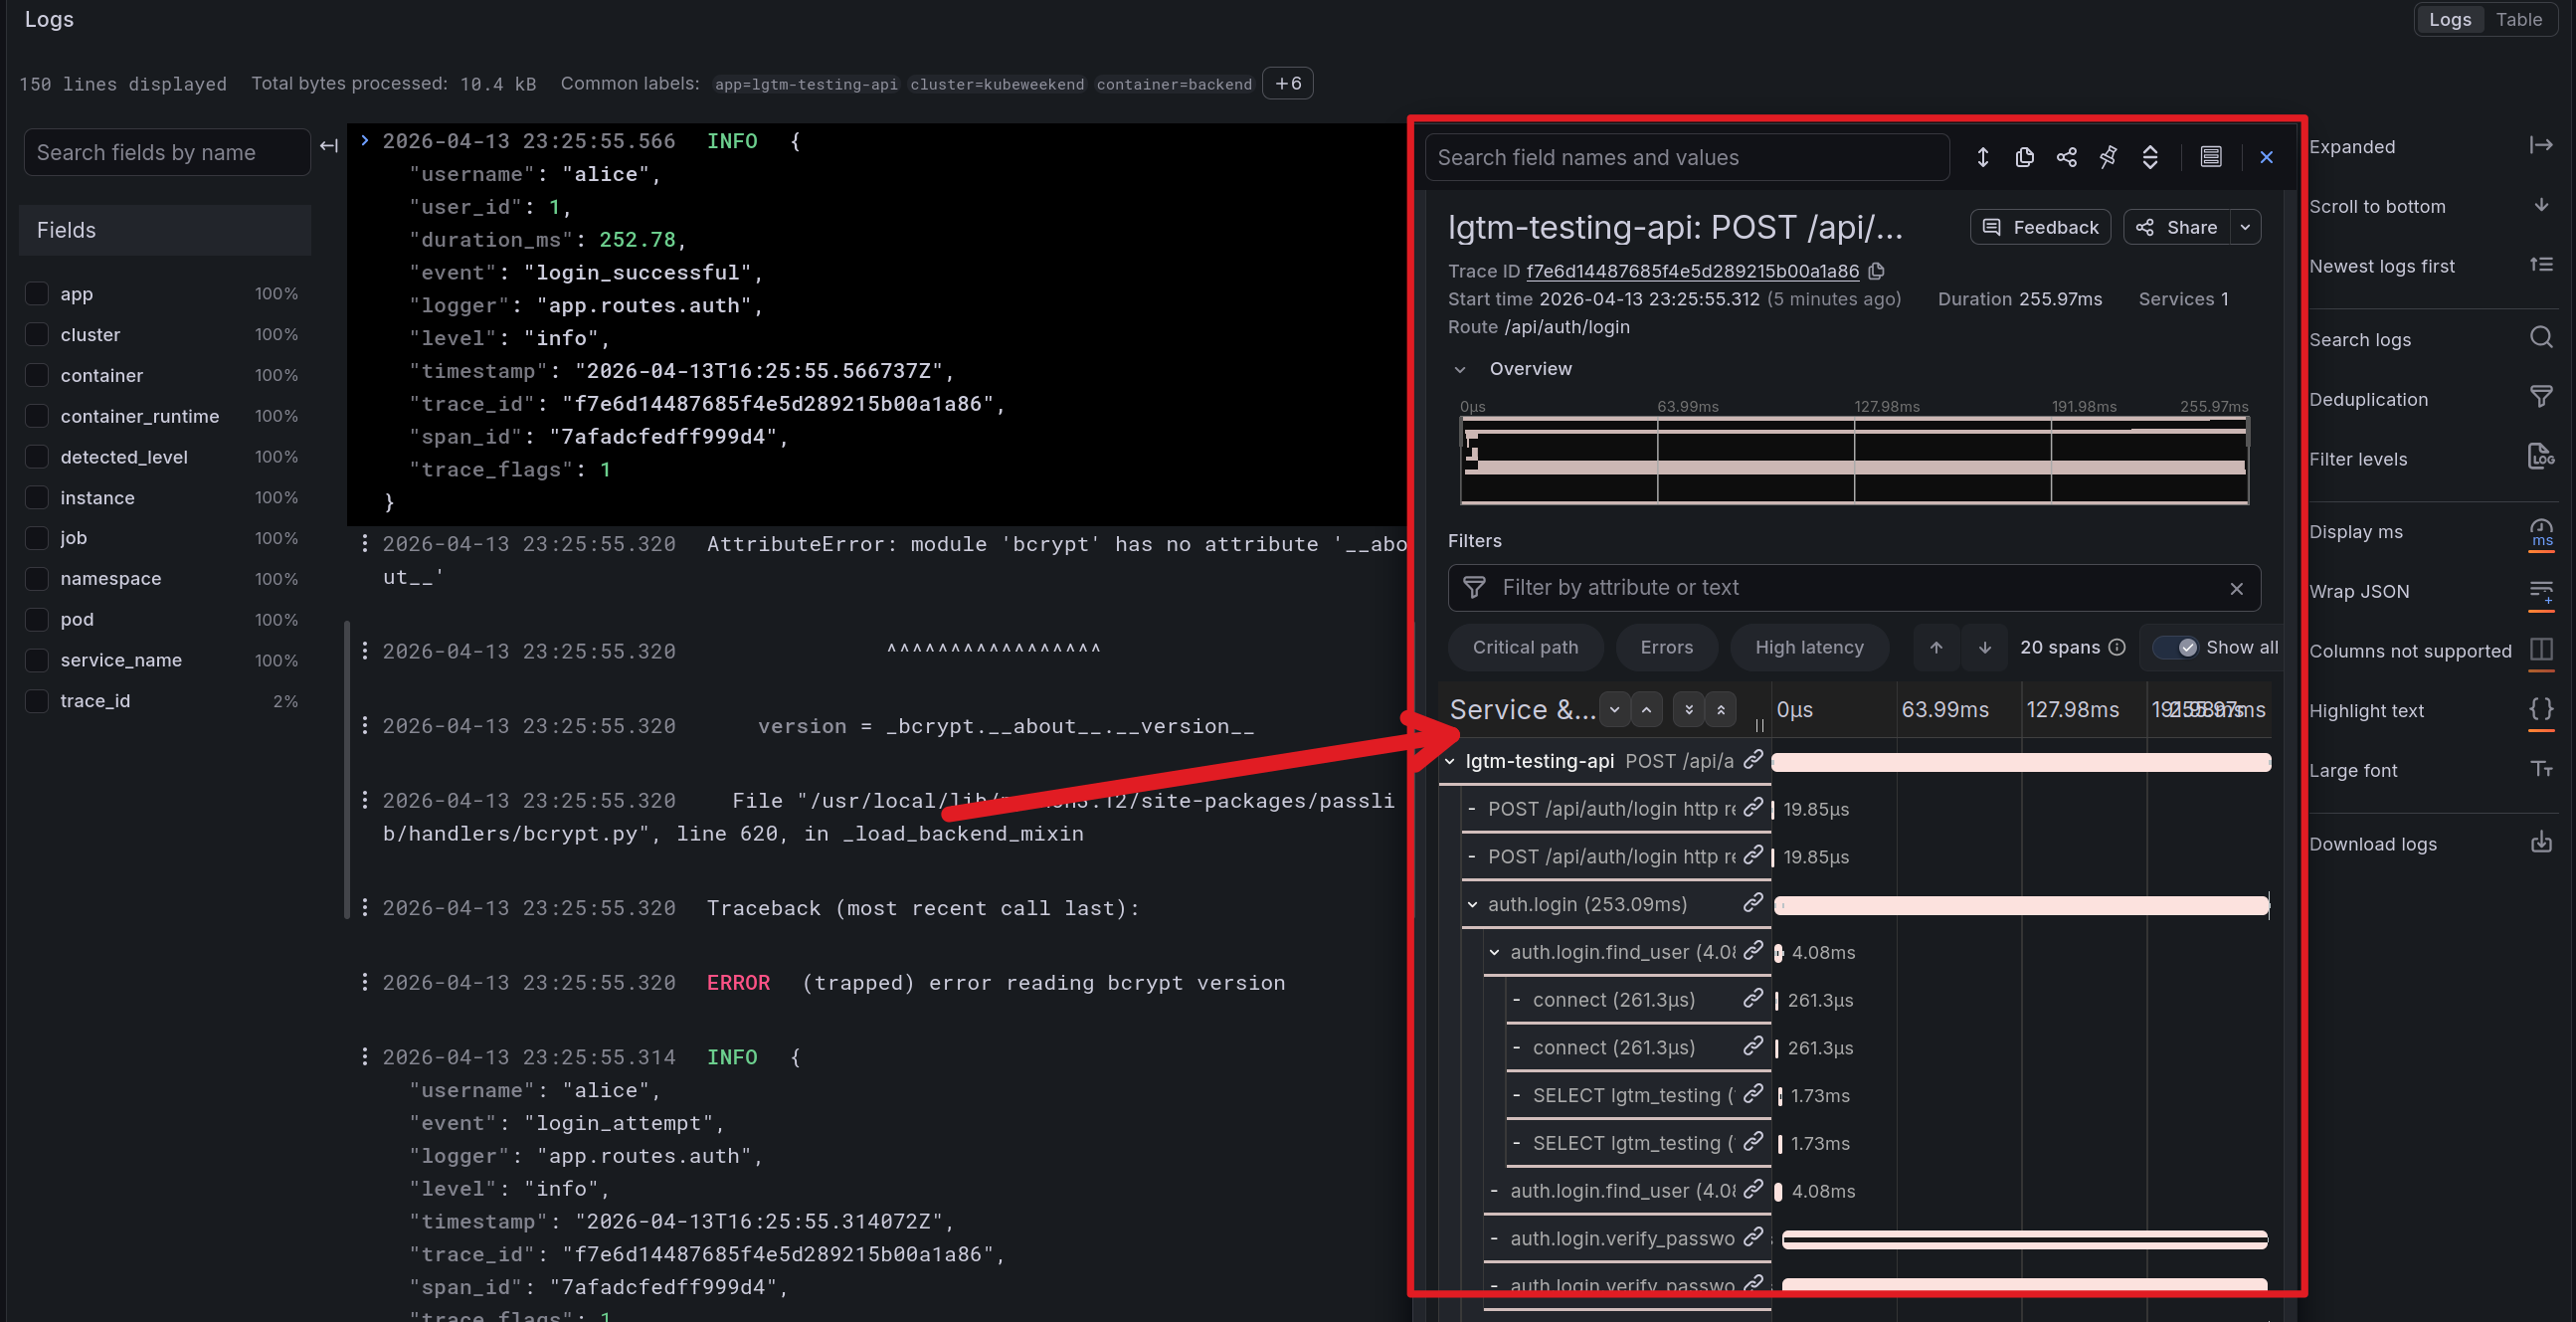
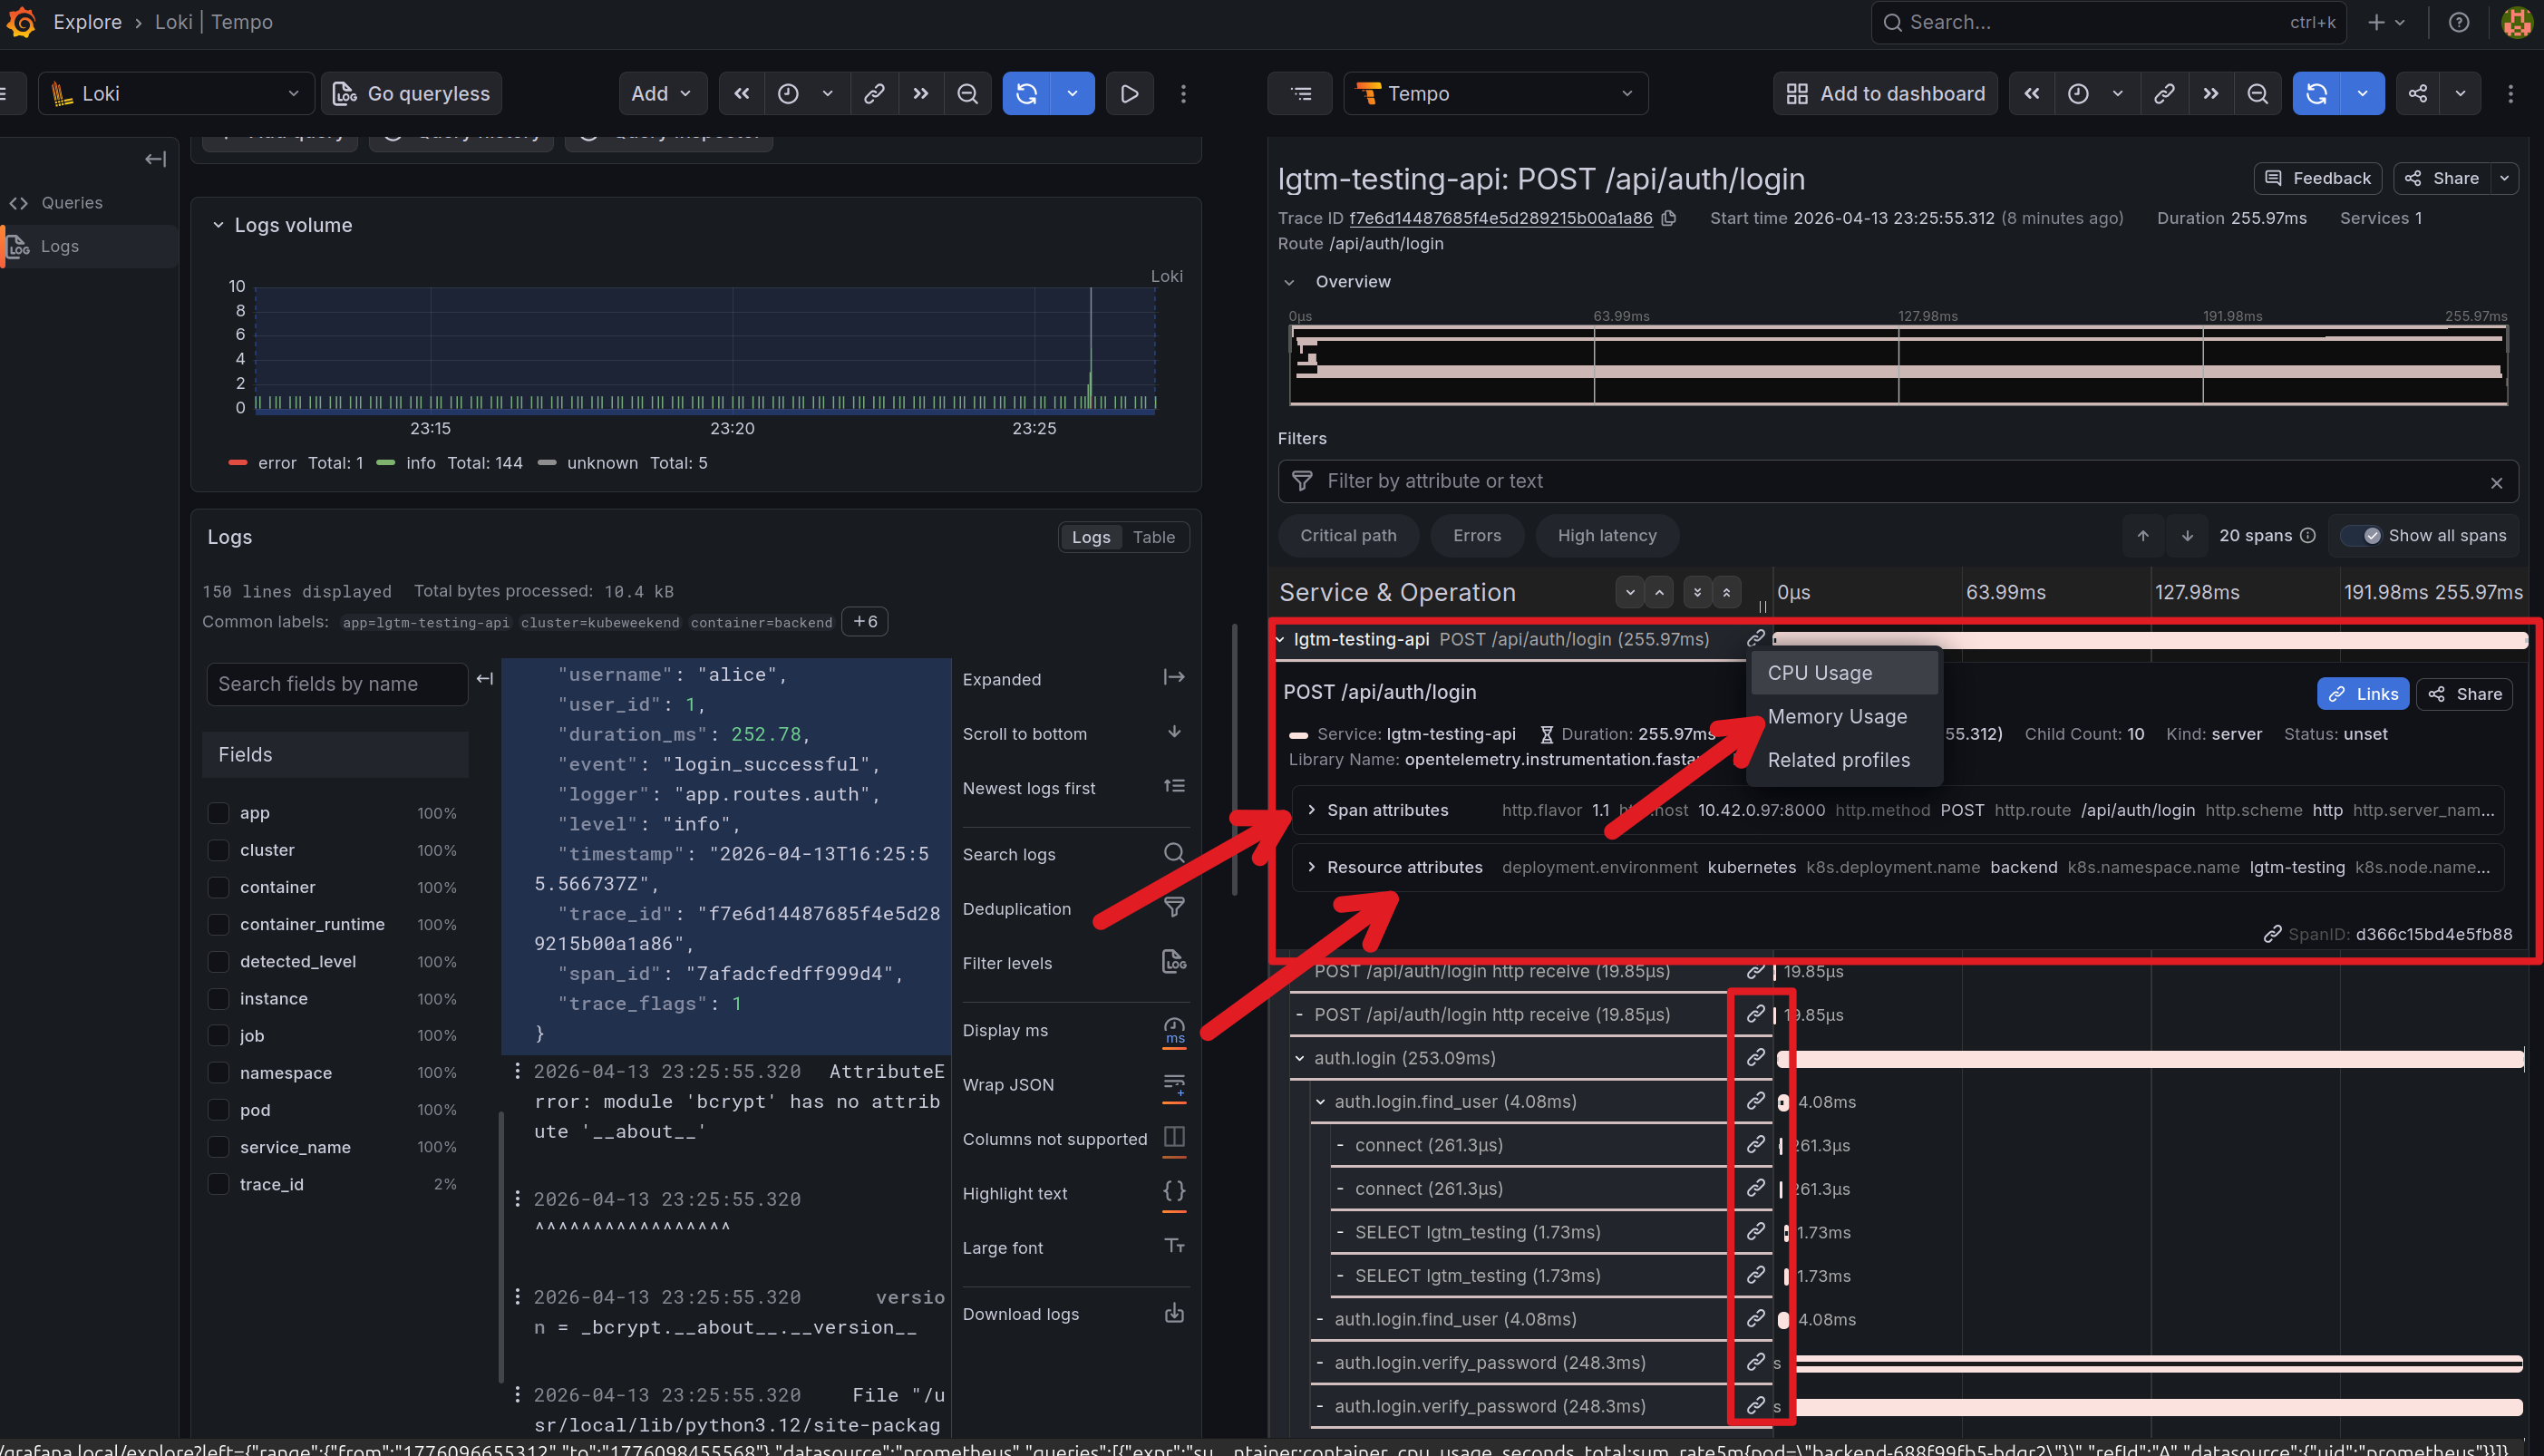
You can get log from Loki and from trace_id from log_line and parse them for tempo searching. You also see the trace on the log via click expand in trace part with log corresponding, or split the via Tempo button
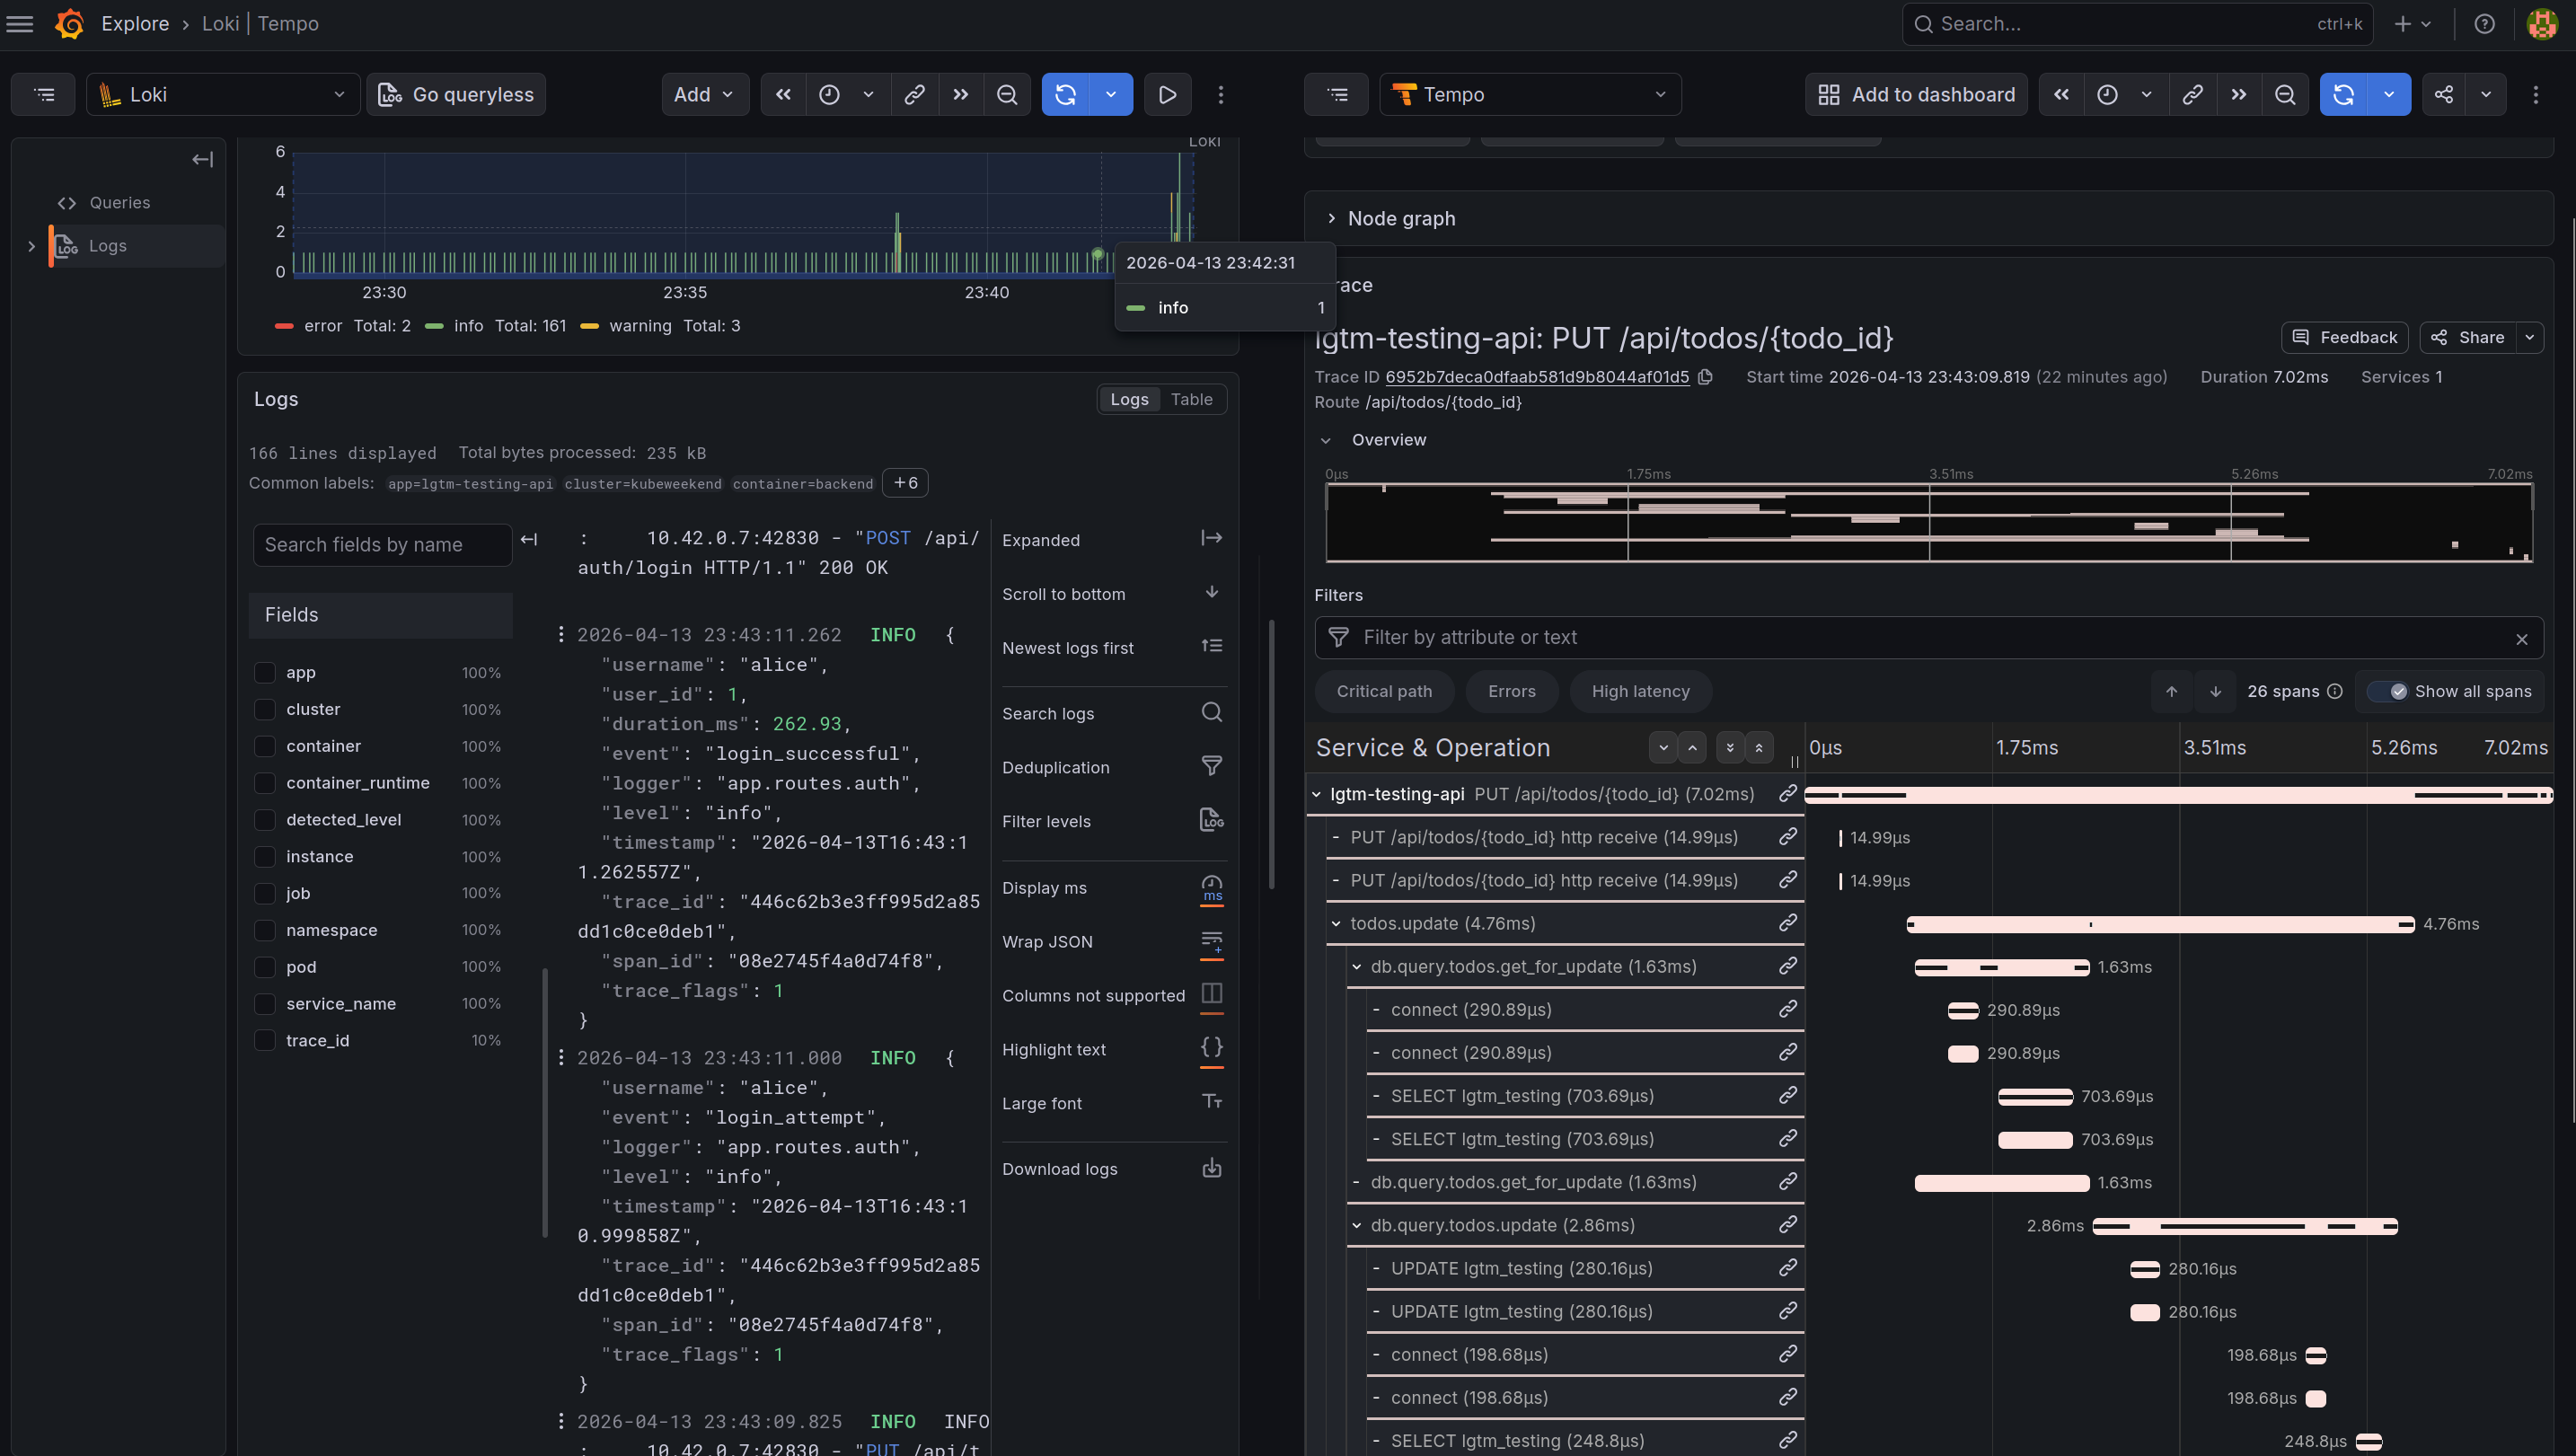
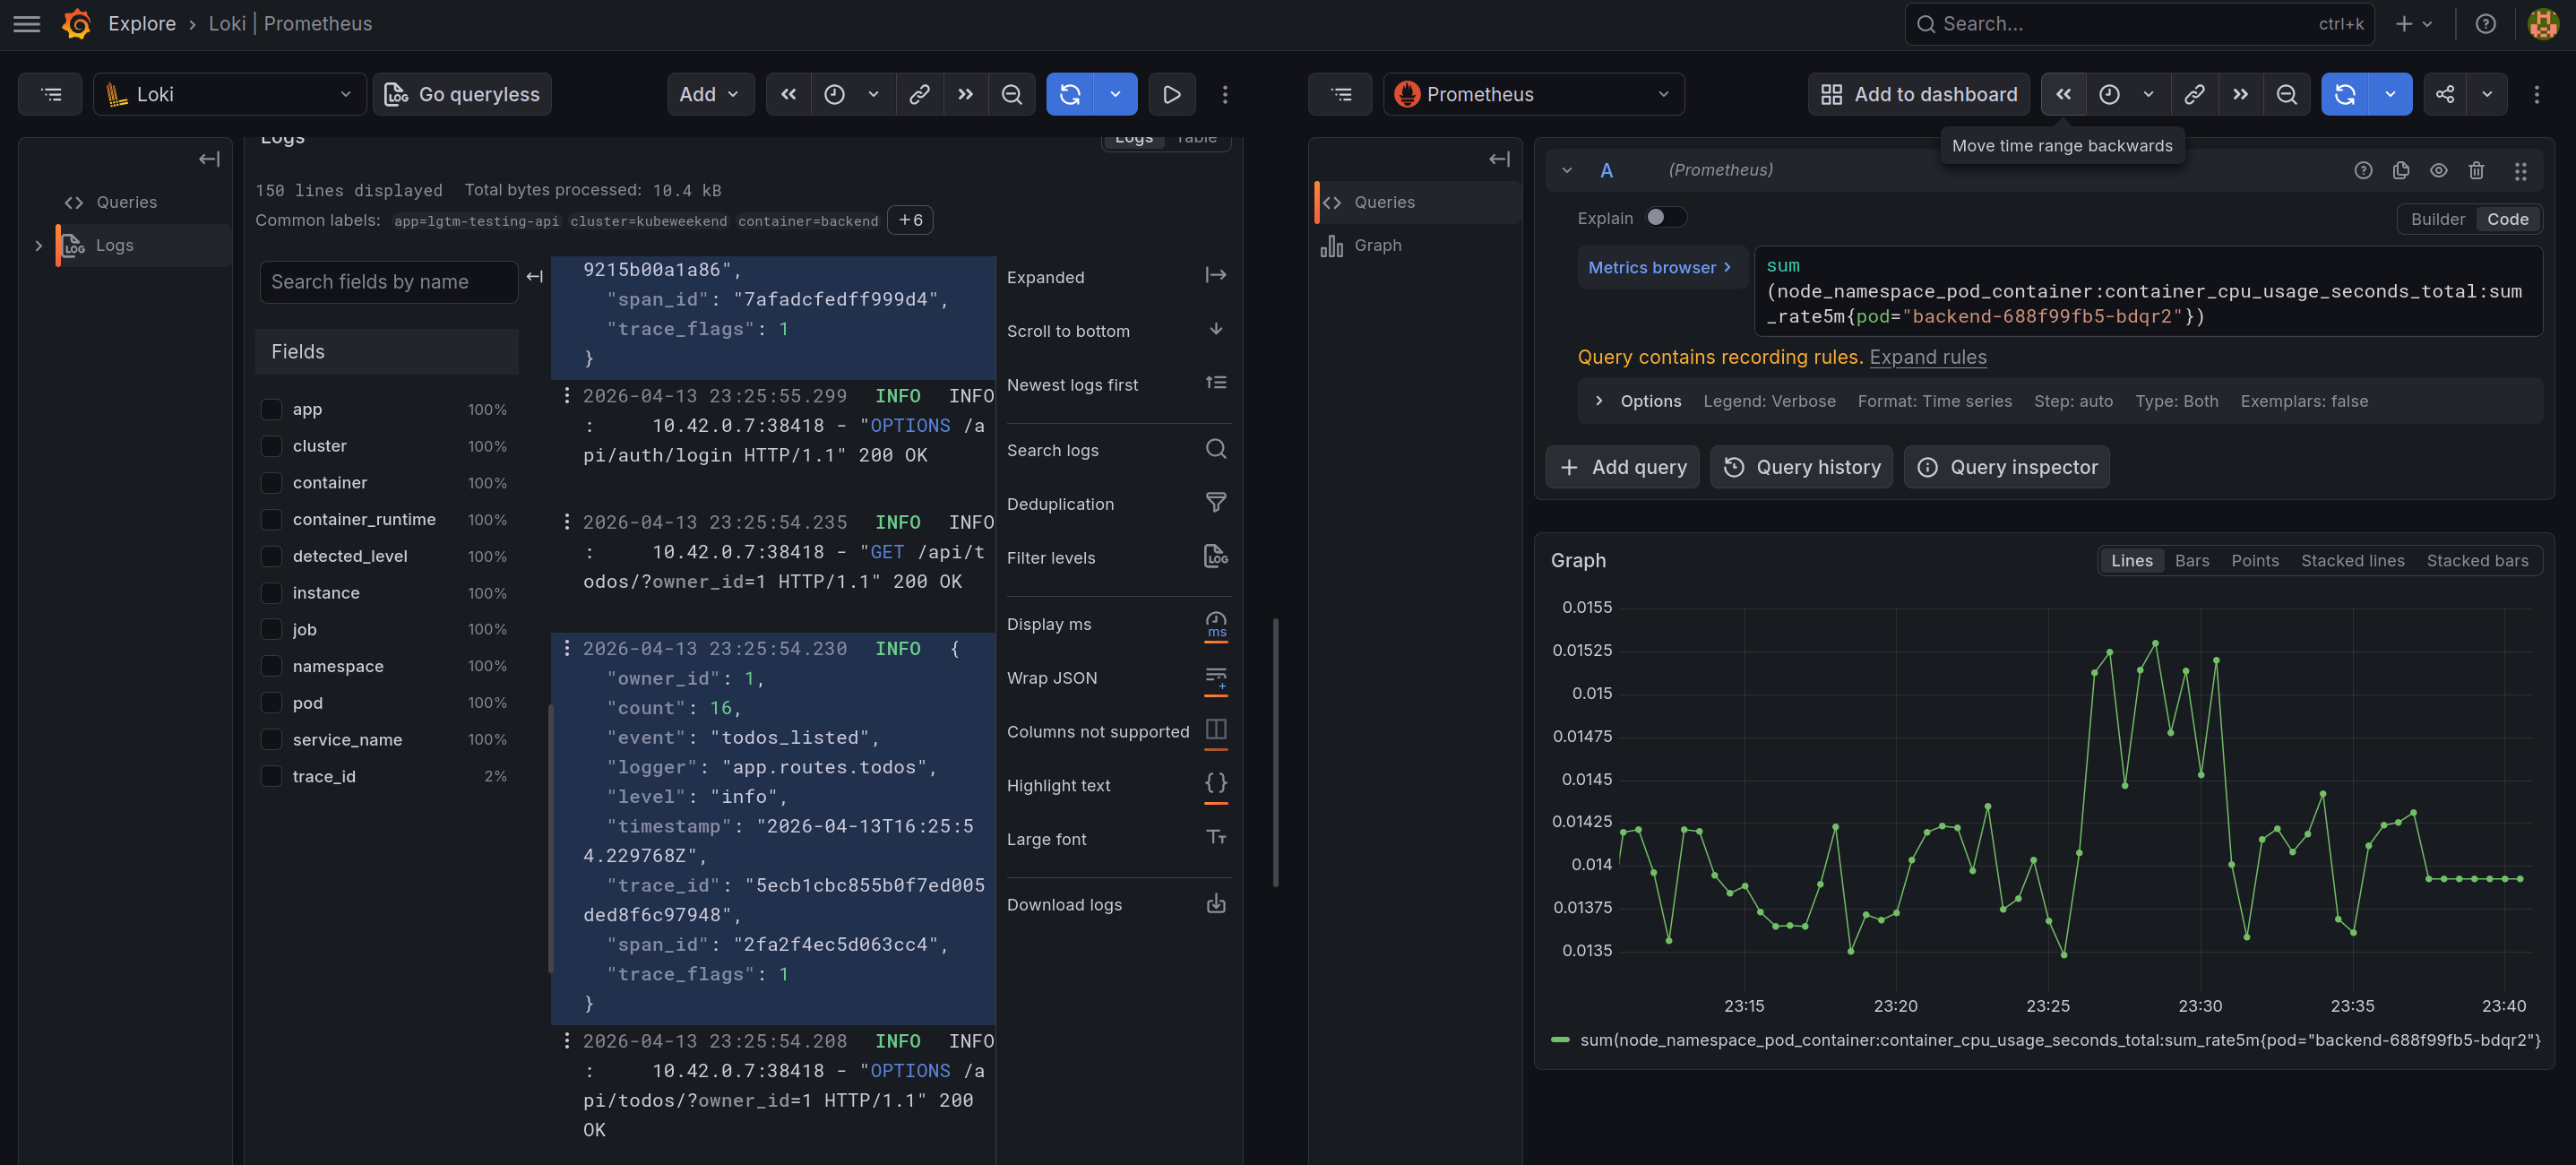
From the trace, you can explore more about the Profiling application and Metrics mapping for that time when you trigger the requests via button linked
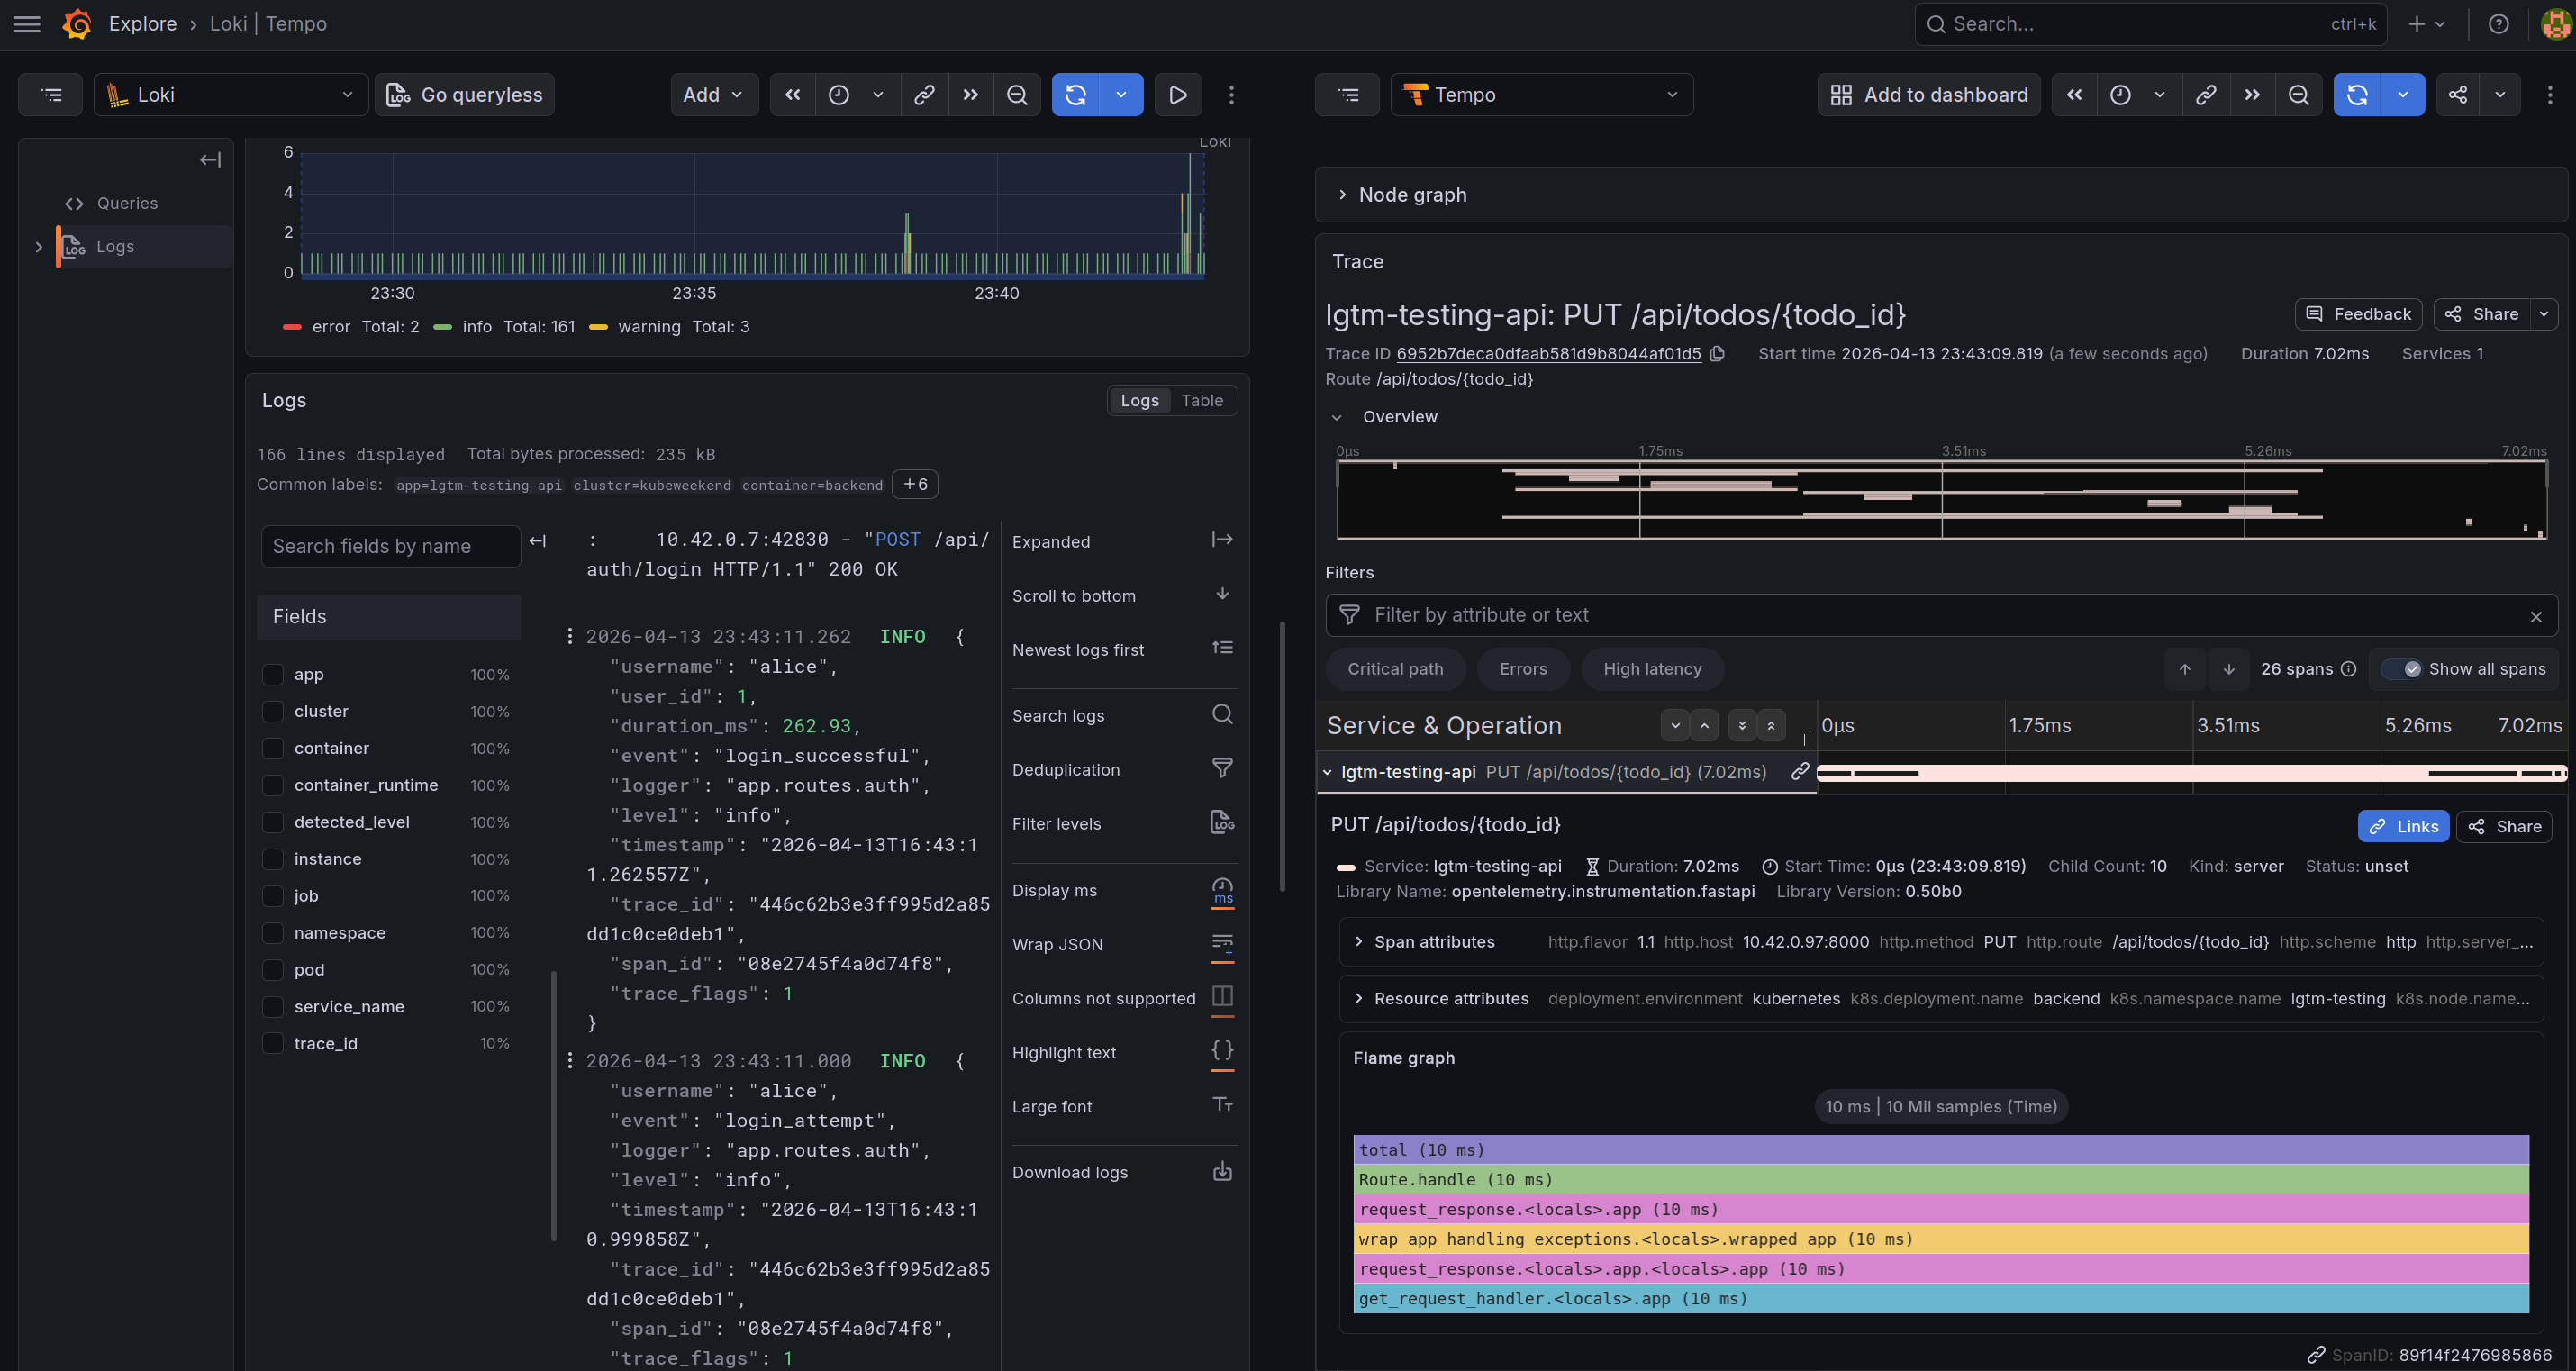
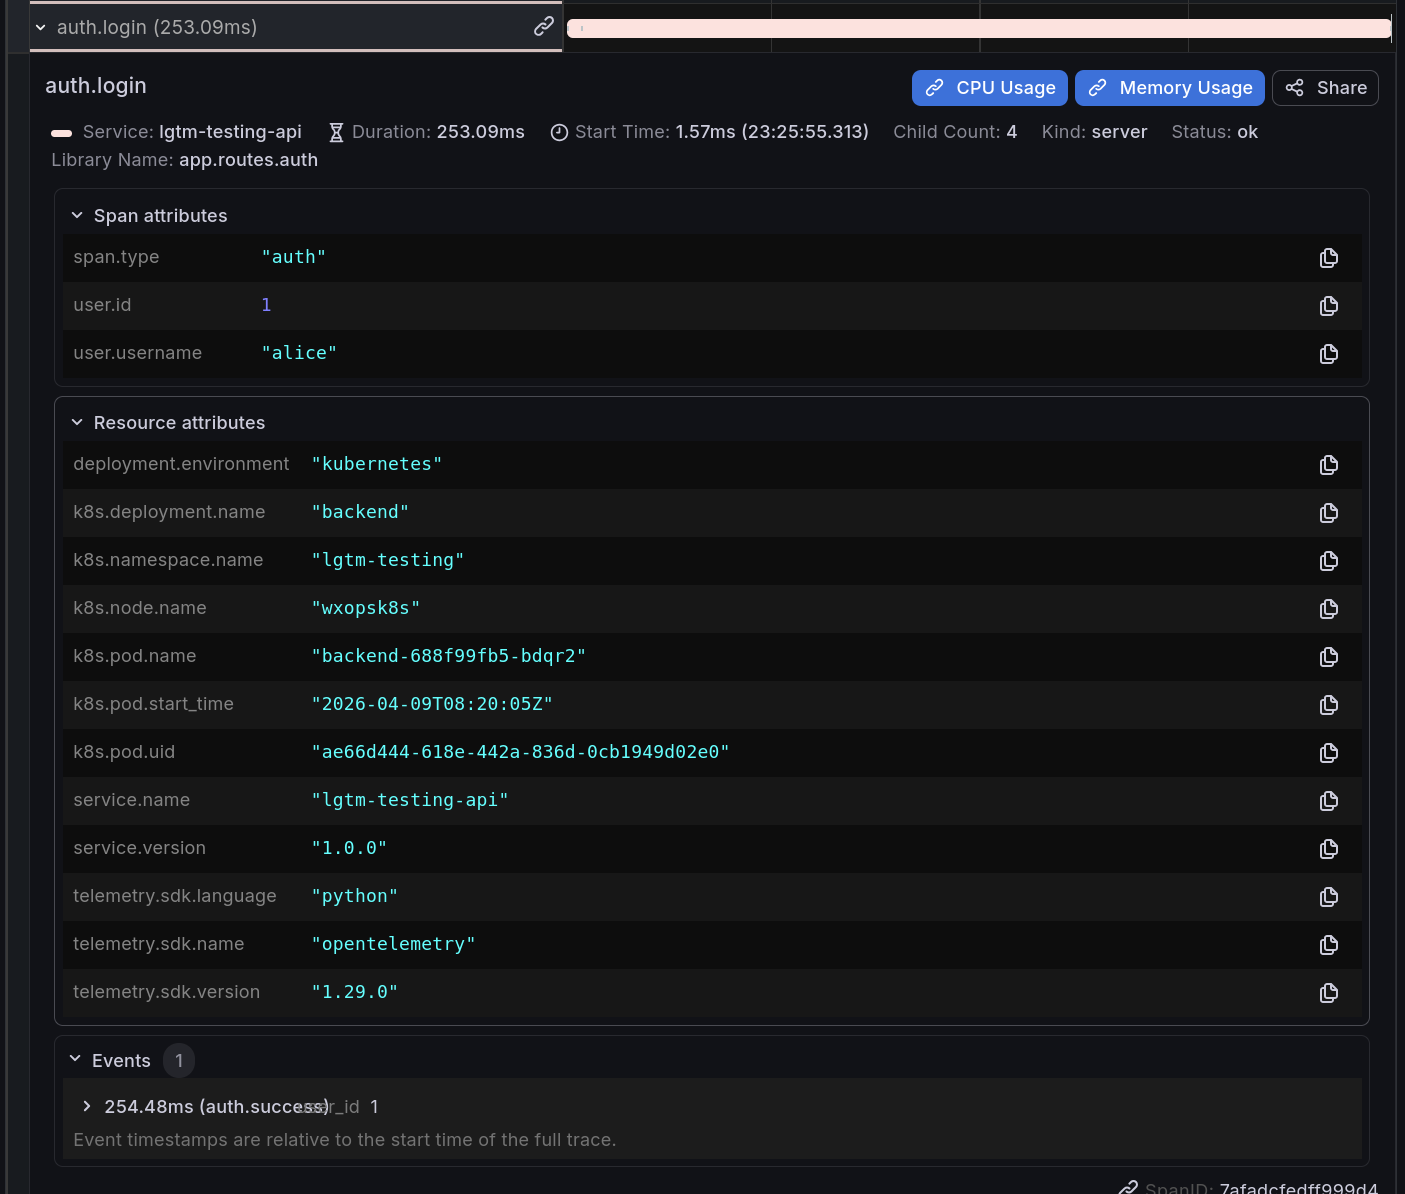
With the trace, you can many information from time-request, trace from small part in request for doing what stuff behind and need how much time to finish. You can see the events and spans attributes showed information about your applications
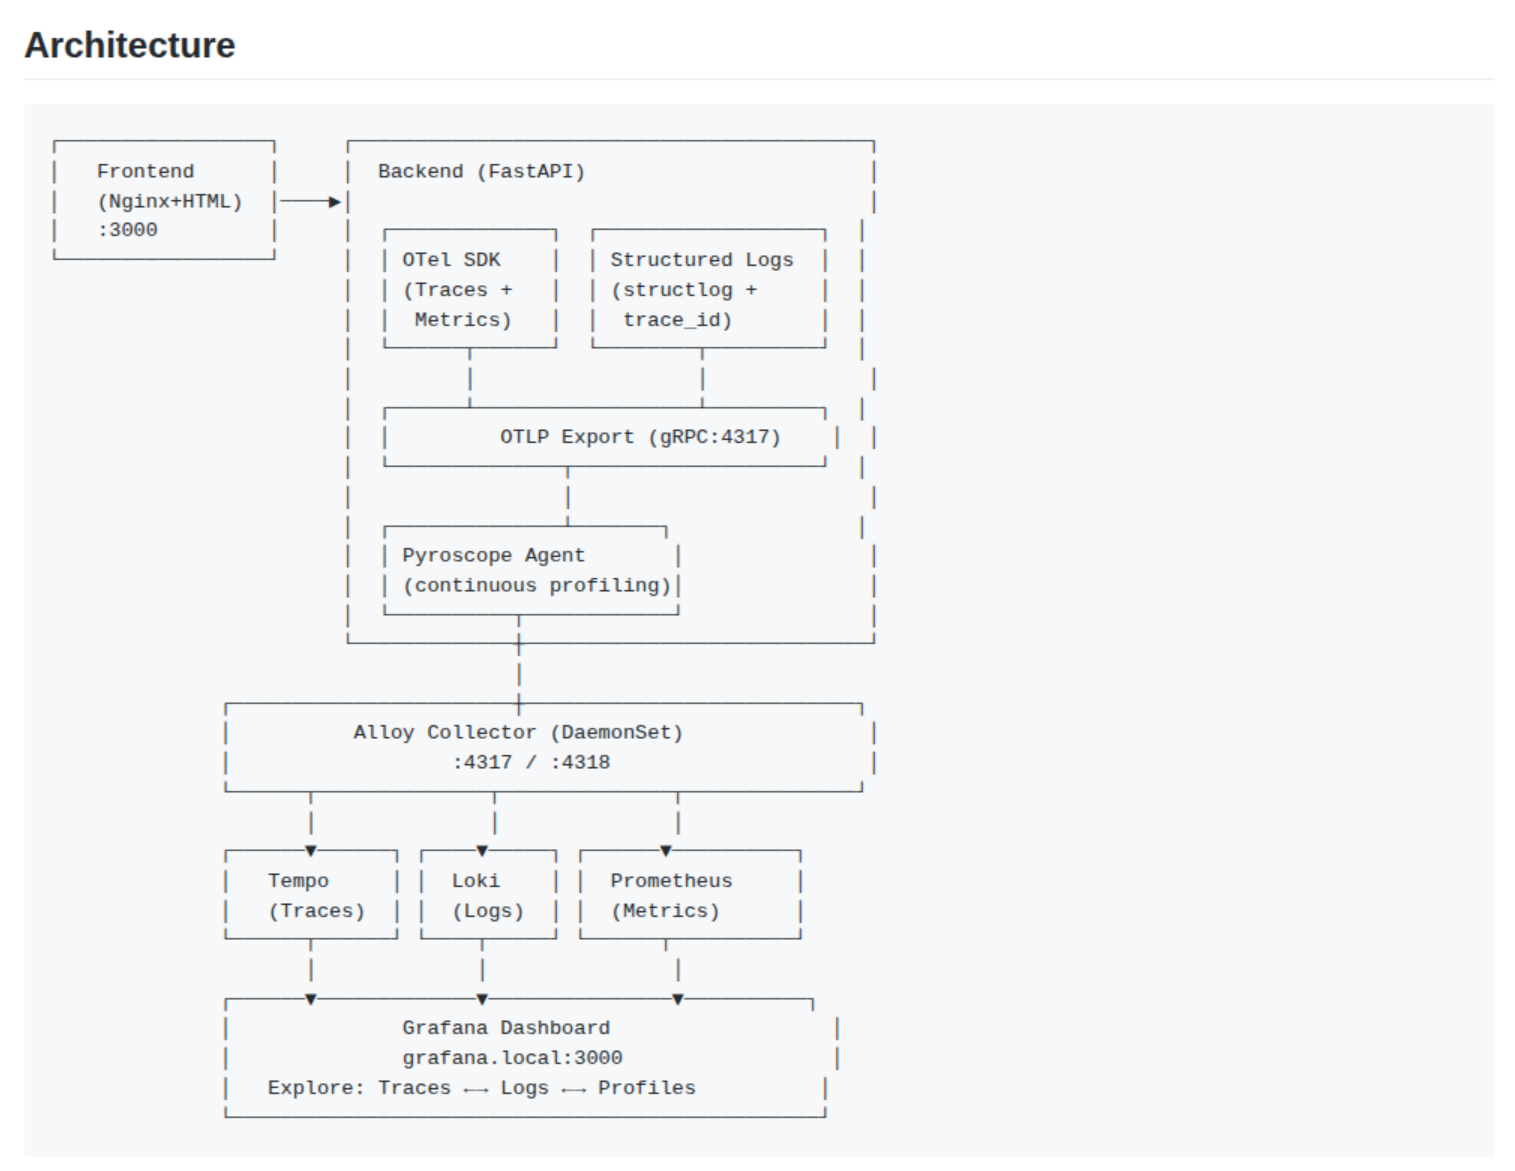
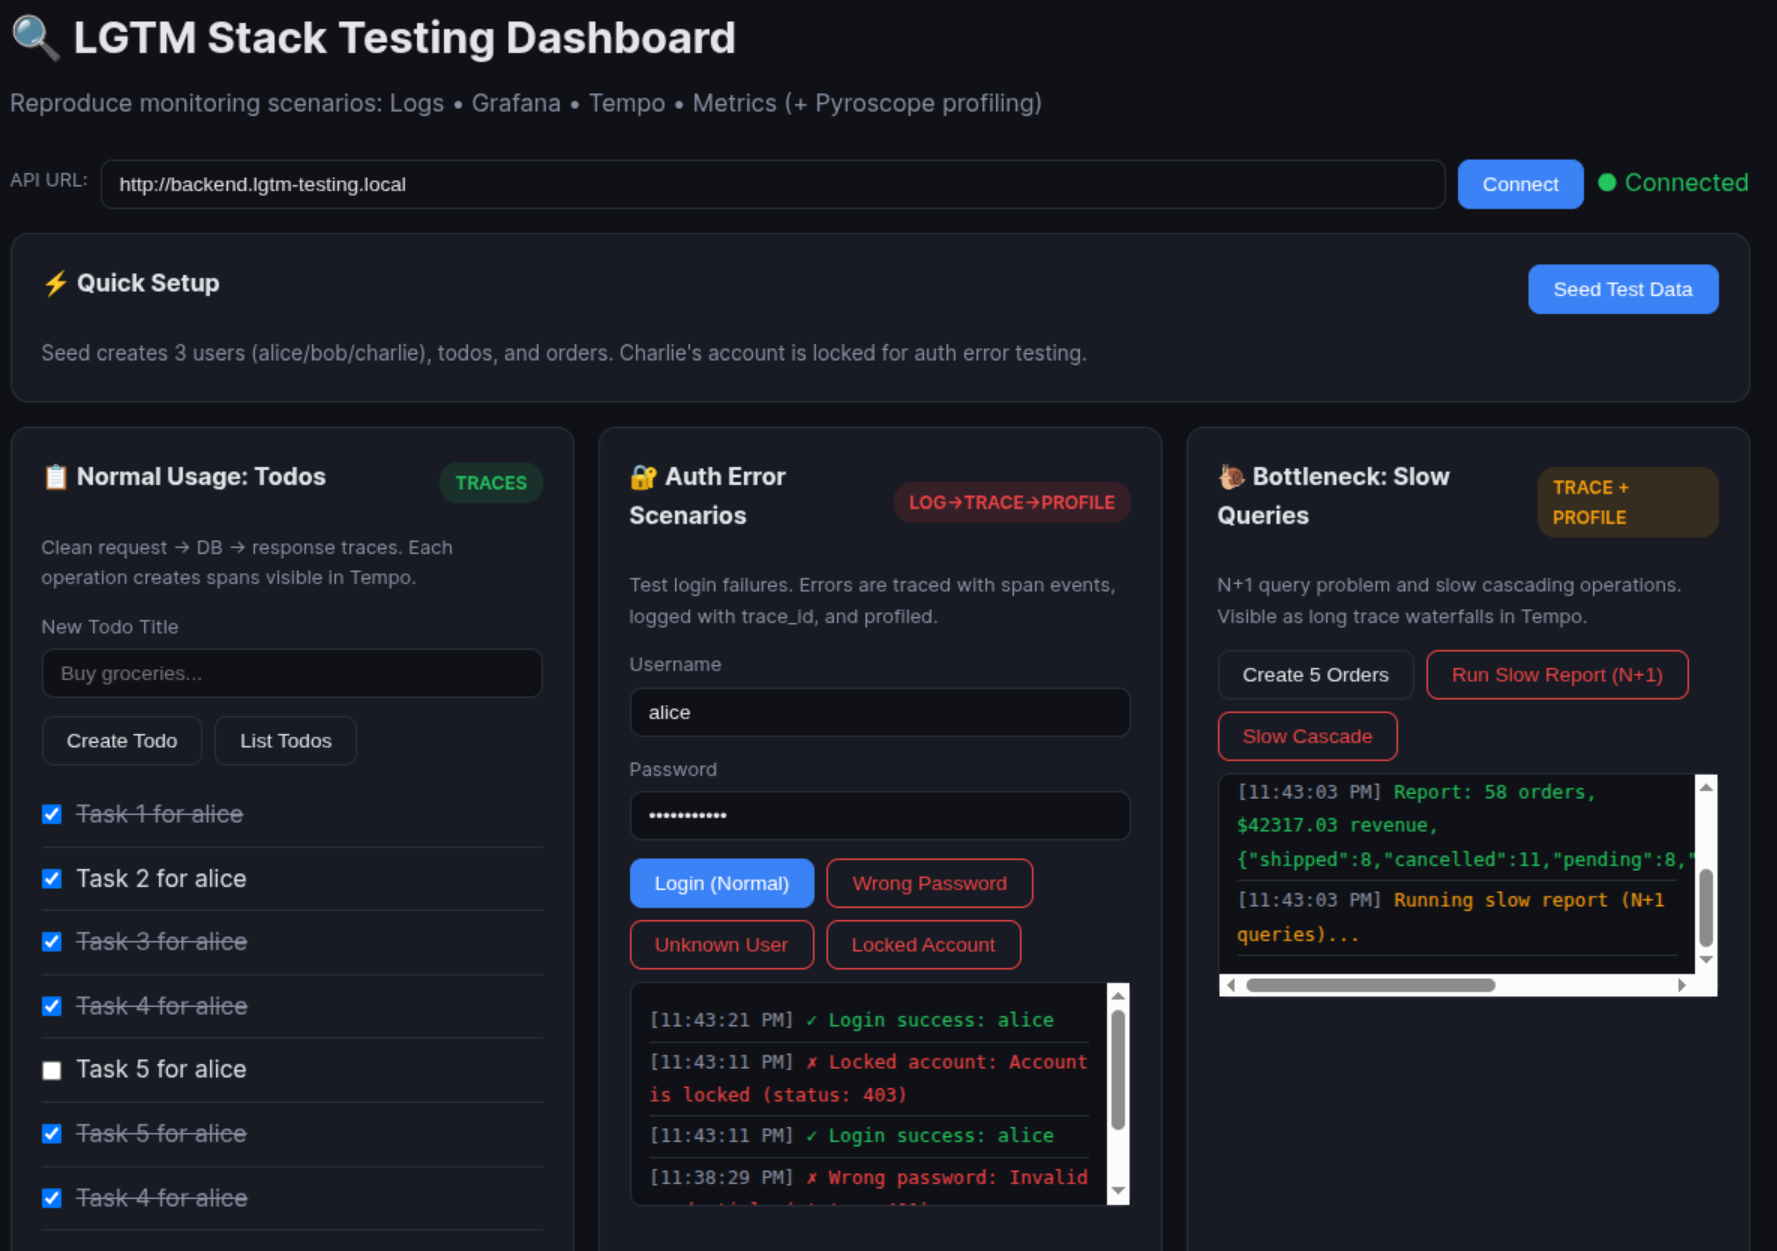
Through the example, you can take several scenarios when you apply component inside LGTM for
Normal Usage (Traces): Goal: Visualize clean request → DB → response trace waterfall in Tempo.
Authentication Errors (Log → Trace → Profile correlation): Goal: Generate auth failures that create error spans, structured error logs with trace_id, and profile data.
Bottleneck Performance (Profiling + Tracing): Goal: Create slow operations visible as long spans in Tempo and hotspots in Pyroscope flamegraphs.
To apply the example above, you can run command below
With them you are available expose backend and frontend ingress, and you need to set domain for your specific host via /etc/hosts
Success
That’s all I would to cover inside Grafana Visualization, but this project is experiment so maybe I will update more features for next time. So if you want to refine or try to implement, you can explore them via my repositories.
Conclusion
Success
As this article comes to a close, my goal remains to uphold the spirit of Kubewekend—inspiring new ideas for experimental Kubernetes environments. I hope you found these insights valuable and discovered modern approaches to monitoring and observability. Stay tuned as we continue to track the rapid evolution of Kubernetes and its observability stacks; it has been a fantastic journey so far.
Quote
With W’xOps entering the final push for its initial MVP release, I will be dedicating much of my time to developing the IDP and documenting the process. The LGTM stack is a core set of components that I will be integrating into W’xOps shortly, and I look forward to sharing those deeper technical experiences with you then. I am grateful for your support; stay motivated, keep growing, and find joy in the process. I’ll see you soon in the next installment of Kubewekend on the Xeus Nguyen Wiki.